{domain:"www.qualitydigest.com",server:"169.47.211.87"} Skip to main content

User account menu
Main navigation
  • Topics
    • Customer Care
    • FDA Compliance
    • Healthcare
    • Innovation
    • Lean
    • Management
    • Metrology
    • Operations
    • Risk Management
    • Six Sigma
    • Standards
    • Statistics
    • Supply Chain
    • Sustainability
    • Training
  • Videos/Webinars
    • All videos
    • Product Demos
    • Webinars
  • Advertise
    • Advertise
    • Submit B2B Press Release
    • Write for us
  • Metrology Hub
  • Training
  • Subscribe
  • Log in
Mobile Menu
  • Home
  • Topics
    • 3D Metrology-CMSC
    • Customer Care
    • FDA Compliance
    • Healthcare
    • Innovation
    • Lean
    • Management
    • Metrology
    • Operations
    • Risk Management
    • Six Sigma
    • Standards
    • Statistics
    • Supply Chain
    • Sustainability
    • Training
  • Login / Subscribe
  • More...
    • All Features
    • All News
    • All Videos
    • Contact
    • Training

How Measurement Error Affects the Four Ways We Use Data

Understanding probable error and the intraclass correlation coefficient makes it possible to quantify measurement uncertainty

Donald J. Wheeler
Mon, 04/04/2011 - 05:30
  • Comment
  • RSS

Social Sharing block

  • Print
Body

Measurement error is generally considered to be a bad thing, and yet there is very little written about how measurement error affects the way we use our measurements.

This column will consider these effects for four different uses of data. But first we need to describe how to characterize measurement error in both an absolute and a relative manner.

The probable error

If we repeatedly measured the same thing thousands of times using the same measurement system, and if our measurements had very small increments, we would end up with a histogram of measurements like figure 1. Given such a collection of measurements, the intuitive estimate for the value of the thing being measured is the average of all of the measurements. But what does the dispersion of the histogram in figure 1 represent?


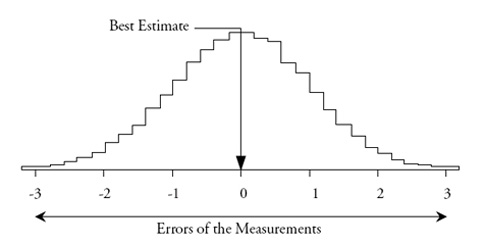
Figure 1: Repeated measurements of the same thing

 …

Want to continue?
Log in or create a FREE account.
Enter your username or email address
Enter the password that accompanies your username.
By logging in you agree to receive communication from Quality Digest. Privacy Policy.
Create a FREE account
Forgot My Password

Add new comment

Image CAPTCHA
Enter the characters shown in the image.
Please login to comment.
      

© 2025 Quality Digest. Copyright on content held by Quality Digest or by individual authors. Contact Quality Digest for reprint information.
“Quality Digest" is a trademark owned by Quality Circle Institute Inc.

footer
  • Home
  • Print QD: 1995-2008
  • Print QD: 2008-2009
  • Videos
  • Privacy Policy
  • Write for us
footer second menu
  • Subscribe to Quality Digest
  • About Us
  • Contact Us