{domain:"www.qualitydigest.com",server:"169.47.211.87"} Skip to main content

User account menu
Main navigation
  • Topics
    • Customer Care
    • FDA Compliance
    • Healthcare
    • Innovation
    • Lean
    • Management
    • Metrology
    • Operations
    • Risk Management
    • Six Sigma
    • Standards
    • Statistics
    • Supply Chain
    • Sustainability
    • Training
  • Videos/Webinars
    • All videos
    • Product Demos
    • Webinars
  • Advertise
    • Advertise
    • Submit B2B Press Release
    • Write for us
  • Metrology Hub
  • Training
  • Subscribe
  • Log in
Mobile Menu
  • Home
  • Topics
    • 3D Metrology-CMSC
    • Customer Care
    • FDA Compliance
    • Healthcare
    • Innovation
    • Lean
    • Management
    • Metrology
    • Operations
    • Risk Management
    • Six Sigma
    • Standards
    • Statistics
    • Supply Chain
    • Sustainability
    • Training
  • Login / Subscribe
  • More...
    • All Features
    • All News
    • All Videos
    • Contact
    • Training

The Tricky Paradox of Mean Time Between Failures

An electrical motor case study serves as a warning

Teofilo Cortizo
Wed, 10/23/2019 - 12:01
  • Comment
  • RSS

Social Sharing block

  • Print
Body

The mean time between failures (MTBF) calculation is widely used to evaluate the reliability of parts and equipment. In the industry it is usually defined as one of the key performance indicators. This short article is intended to demonstrate in practice how we can fool ourselves by evaluating this indicator in isolation.

ADVERTISEMENT

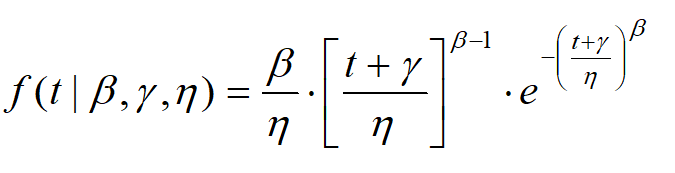
We get real data from two failure modes of a conical-crusher drive system: failure of the electric motor, and failure of the grid spring coupling. With the use of reliability software, it was possible to estimate in two parametric Weibull modeling two parameters, that is, the gamma parameter (γ) = 0:

Electric motor failure
β = 0,46
η = 3491

Grid spring coupling failure
β =0,24
η = 857

By the characteristics of the value of the two parameters, we conclude that the coupling failure has a higher probability of occurring at the beginning of its life. Based on this modeling, it is possible to calculate the MTBF of each failure mode:

 …

Want to continue?
Log in or create a FREE account.
Enter your username or email address
Enter the password that accompanies your username.
By logging in you agree to receive communication from Quality Digest. Privacy Policy.
Create a FREE account
Forgot My Password

Add new comment

Image CAPTCHA
Enter the characters shown in the image.
Please login to comment.
      

© 2025 Quality Digest. Copyright on content held by Quality Digest or by individual authors. Contact Quality Digest for reprint information.
“Quality Digest" is a trademark owned by Quality Circle Institute Inc.

footer
  • Home
  • Print QD: 1995-2008
  • Print QD: 2008-2009
  • Videos
  • Privacy Policy
  • Write for us
footer second menu
  • Subscribe to Quality Digest
  • About Us
  • Contact Us