{domain:"www.qualitydigest.com",server:"169.47.211.87"} Skip to main content

User account menu
Main navigation
  • Topics
    • Customer Care
    • FDA Compliance
    • Healthcare
    • Innovation
    • Lean
    • Management
    • Metrology
    • Operations
    • Risk Management
    • Six Sigma
    • Standards
    • Statistics
    • Supply Chain
    • Sustainability
    • Training
  • Videos/Webinars
    • All videos
    • Product Demos
    • Webinars
  • Advertise
    • Advertise
    • Submit B2B Press Release
    • Write for us
  • Metrology Hub
  • Training
  • Subscribe
  • Log in
Mobile Menu
  • Home
  • Topics
    • 3D Metrology-CMSC
    • Customer Care
    • FDA Compliance
    • Healthcare
    • Innovation
    • Lean
    • Management
    • Metrology
    • Operations
    • Risk Management
    • Six Sigma
    • Standards
    • Statistics
    • Supply Chain
    • Sustainability
    • Training
  • Login / Subscribe
  • More...
    • All Features
    • All News
    • All Videos
    • Contact
    • Training

Product Announcement: Pressurex Extreme Low Pressure Indicating Film

New sensor film range maps and measures extremely low contact pressures.

Mon, 06/08/2009 - 14:47
  • Comment
  • RSS

Social Sharing block

  • Print
Body

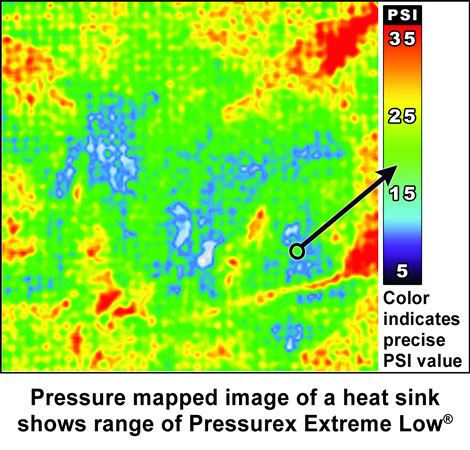
(Sensor Products: Madison, New Jersey) -- Sensor Products Inc. announces Pressurex Extreme Low, the newest addition to its tactile pressure-indicating sensor films. Pressurex Extreme Low characterizes contact surface pressure down to an extremely low 7.2 PSI (0.5 kg/cm2). The range is 7.2 – 28 PSI (0.5 – 1.97 kg/cm2). Pressurex is available in eight distinct pressure ranges. The highest pressure range reveals pressure as high as 18,500 – 43,200 PSI (1,300 – 3,000 kg/cm2).

Pressurex is coated on a Mylar-based sheet (4 or 8 mil), and is similar in appearance to paper. When placed between contacting surfaces, Pressuex film instantaneously and permanently changes color in direct proportion to the actual pressure applied. The precise pressure magnitude (PSI or kg/cm2) is easily determined by comparing color variation results to a color correlation chart (conceptually similar to interpreting Litmus paper).

 …

Want to continue?
Log in or create a FREE account.
Enter your username or email address
Enter the password that accompanies your username.
By logging in you agree to receive communication from Quality Digest. Privacy Policy.
Create a FREE account
Forgot My Password

Add new comment

Image CAPTCHA
Enter the characters shown in the image.
Please login to comment.
      

© 2025 Quality Digest. Copyright on content held by Quality Digest or by individual authors. Contact Quality Digest for reprint information.
“Quality Digest" is a trademark owned by Quality Circle Institute Inc.

footer
  • Home
  • Print QD: 1995-2008
  • Print QD: 2008-2009
  • Videos
  • Privacy Policy
  • Write for us
footer second menu
  • Subscribe to Quality Digest
  • About Us
  • Contact Us