
{domain:"www.qualitydigest.com",server:"169.47.211.87"} Skip to main content

        
User account menu
Main navigation
  • Topics
    • Customer Care
    • Regulated Industries
    • Research & Tech
    • Quality Improvement Tools
    • People Management
    • Metrology
    • Manufacturing
    • Roadshow
    • QMS & Standards
    • Statistical Methods
    • Resource Management
  • Videos/Webinars
    • All videos
    • Product Demos
    • Webinars
  • Advertise
    • Advertise
    • Submit B2B Press Release
    • Write for us
  • Metrology Hub
  • Training
  • Subscribe
  • Log in
Mobile Menu
  • Home
  • Topics
    • Customer Care
    • Regulated Industries
    • Research & Tech
    • Quality Improvement Tools
    • People Management
    • Metrology
    • Manufacturing
    • Roadshow
    • QMS & Standards
    • Statistical Methods
    • Supply Chain
    • Resource Management
  • Login / Subscribe
  • More...
    • All Features
    • All News
    • All Videos
    • Contact
    • Training

Color Space vs. Color Tolerance

Calculating tolerance between two colors is like determining distance between two cities on a map

Tim Mouw
Mon, 04/09/2018 - 12:01
  • Comment
  • RSS

Social Sharing block

  • Print
Body

To control color, you need to be able to compare very small differences, determine their impact and understand how to address that impact. In this series we’ve already looked at the history of color analysis and the role of light in tolerancing. Here we’ll discuss the difference between a color space and a color tolerance, and introduce the most common methods.

ADVERTISEMENT

Color spaces

A color space gives us a way to communicate color. Just like we can find any location on planet Earth using longitude, latitude, and altitude, we can locate any color in color space.

Here are the two most common color spaces:
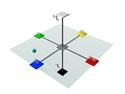
tolerancing-part-3-01L*a*b*, aka CIELab, aka LAB Model

During the 1940s, Richard Hunter introduced a tri-stimulus model, Lab, which is scaled to achieve near uniform spacing of perceived color differences.

 …

Want to continue?
Log in or create a FREE account.
Enter your username or email address
Enter the password that accompanies your username.
By logging in you agree to receive communication from Quality Digest. Privacy Policy.
Create a FREE account
Forgot My Password
Top Stories
Beyond the Statistics: Implementing the New VDA AIAG SPC Manual
Multivariate Charts
All Whys Are Not The Same
Flying Blind: What Your Quality Data Miss Every Shift
Book Preview
The Psychology of AI Adoption at Work

Add new comment

Please login to comment.

© 2026 Quality Digest. Copyright on content held by Quality Digest or by individual authors. Contact Quality Digest for reprint information.
“Quality Digest" is a trademark owned by Quality Circle Institute Inc.

footer
  • Home
  • Print QD: 1995-2008
  • Print QD: 2008-2009
  • Videos
  • Privacy Policy
  • Write for us
footer second menu
  • Subscribe to Quality Digest
  • About Us
  • Contact Us