Social Sharing block
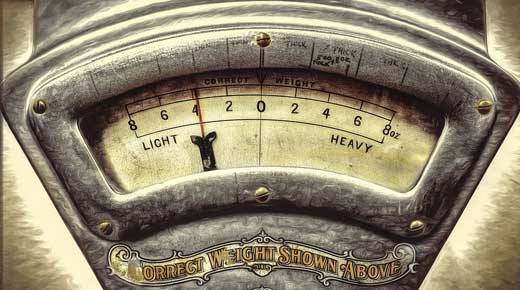
Every manufacturing company that gets audited, anywhere in the world, is required to do gauge repeatability and reproducibility (R&R) studies. In some cases, this one study is the only chance to find unknown problems with measurement quality. (When problems do occur, it is often downstream from calibration.) It’s important to clearly understand gauge R&R studies, and make the most of them. This article will explain the details and show how to perform gauge R&R studies using a popular software product.
|
ADVERTISEMENT |
The basics
The method is to measure variables of production measuring processes, and the primary variables are repeatability and reproducibility. The purpose is to confirm that variation is not excessive, or to take action if variation is found to be excessive. This is required for each production measuring process but not for each gauge—you might have 3,000 gauges and only 200 production measuring processes.
…
Comments
% contribution column
The only column that is useful in this study is the % contribution one which is calculated using variances not std deviation. %GRR + %PV HAS TO EQUAL 100%.
If you want to "get corect results" please read Wheeler's article on GRR studies.
There's a lot more to understanding how to perform useful statistical studies than pressing a button using some software package.
Rich
Alternative Measures of Gauge Capability
The previous comment raises non-basic, but interesting questions; you are encouraged to use whichever gauge capability ratio is your personal preference. You don’t have to use GRR%. The software used in this case presents 8 different choices out of a dozen or so possibilities. If I may use Dr. Wheeler for example, and assume that Dr. Wheeler still prefers to use “intraclass correlation coefficient” (ICC); when evaluating Figure 2 in the article, he would look at the 8 choices and choose “PV % Contribution,” (because ICC isn’t there, and PV % Contribution is numerically equivalent to ICC).
PV % Contribution is locked in a mathematical relationship with GRR% and with all of the other choices. GRR% of TV = 30% is always precisely equivalent to PV % Contribution = 91%. In Figure 2, users of GRR% of TV will reject because GRR% exceeds 30%, and users of PV % Contribution will reject because PV % Contribution is less than 91%. The two groups will use different statistics to arrive at identical decisions.
Automotive customers don’t care which way you do it. Either way, they get the level of protection specified in the contract.
Gary Phillips
Sampling for a GRR
In my study of a GRR, the range of parts you choose for the 10 samples greatly affects the NDC or %GRR. My opinion previously is that I want my gage to be able to determine the difference between good and no good parts, so I have chosen parts to range from out of tolerance low to out of tolerance high. Recently I have seen posts that my sampling should be random according to the current process, but I don't think this tests the gage's ability to determine the difference between good/no good.
What is your opinion of manufacturing the study to include out of tolerance parts?
Gage R & R
We have a product that we make that is very hard to measure. We use tape measures but, it is very easy to get what you want out of it and 3 people could easily come up with different results. My question is this, do you need to use the product you are measuring to conduct the R & R. You are measuring the measurement system so couldn't you just measure blocks of wood? thanks.
Statistical justification
Is there any formal statistical justification for
quote " Normal sample sizes are 10 parts, three operators, and three trials for a total of 90 measurements."?
Thank you
Add new comment