Cost for QD employees to rent an apartment in Chico, CA. $1,200/month. Please turn off your ad blocker in Quality Digest
Our landlords thank you.
Rachel Tracy
Published: Tuesday, June 7, 2016 - 12:18 Two things are true when it comes to making important decisions that affect your company: You need a way to quantify risk to make the best choice, and you need to be able to explain that choice. A risk matrix helps you do both. Calculating risk across various outcomes can give you clear guidelines on whether the risk is acceptable or unacceptable. Let’s take a look at the process. 
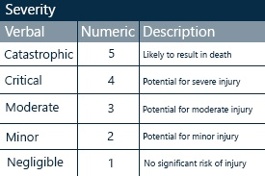
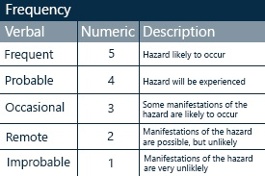
In simple terms, risk is defined as the probability of an event multiplied by its impact. Levels of probability and impact can be broken up into verbal and numerical scales like so: The risk matrix then plots these variables in a color-coded chart to show overall risk for different situations: The quantified risk falls into one of three zones: Deciding whether risk is acceptable or not often comes down to a cost/benefit calculation. For example, it would be difficult to justify spending $2 million to prevent an ergonomic injury, whereas it would be worth it to prevent a chemical explosion. There’s a lot of variability in how to use a risk matrix, so here’s a quick look at three examples. Environmental health and safety (EHS) The pipeline has had multiple maintenance issues, and it’s located next to a regulated stream. You think it’s likely some leakage may occur, and if it leaked you could end up killing off a population of endangered salamanders that live there. Automated risk-matrix tools in your environmental health and safety (EHS) management system tell you this borders on unacceptable risk, so you decide to move forward with additional controls. Quality management Your quality management system calculates each supplier’s risk for you, showing that Supplier A has more incidents than Supplier B but actually poses less risk. This could be because Supplier B’s product plays a strategic role in your process or consumer safety, while Supplier A’s incidents have an overall negligible impact. You wisely decide to focus your efforts on Supplier B. Food safety In this case, you’ve set up your food safety management system (FSMS) to use a weighted scale rather than straight multiplication, with lower numbers representing a higher risk. Let’s say internal policies dictate that anything receiving a risk rating between 1 and 10 needs a CCP. Based on how the scales were plotted, you can see high risk at top left and low risk at bottom right. Because serious illness could occur and the situation is rated an 8, you will need an extra CCP. Your FSMS automatically feeds the information into your hazard analysis so you can record your decision. It’s important to remember that a risk matrix is just a tool, not a solution. For true effectiveness, you need people who can interpret the results, ask questions, and vet your risk matrix by testing it against historical data. With these pieces in place, the results are very powerful, helping standardize your decisions and providing quantitative justification for them. Learn more about reducing risk in your company with the free guidebook, “Building a Compliant Risk Management Program.” Quality Digest does not charge readers for its content. We believe that industry news is important for you to do your job, and Quality Digest supports businesses of all types. However, someone has to pay for this content. And that’s where advertising comes in. Most people consider ads a nuisance, but they do serve a useful function besides allowing media companies to stay afloat. They keep you aware of new products and services relevant to your industry. All ads in Quality Digest apply directly to products and services that most of our readers need. You won’t see automobile or health supplement ads. So please consider turning off your ad blocker for our site. Thanks, Rachel Tracy has worked as an environmental consultant, researcher, and educator. Across every job was one common thread: writing. Her core service areas include newsletters, case studies, special reports, white papers, articles, press releases, online content, blog posts, and website reviews. Tracy has a master’s degree in earth and environmental science and a bachelor’s degree in natural resources.Creating a Risk Matrix: Three Examples
Manage risk thoughtfully
How a risk matrix works
1. Low risk that’s considered acceptable (green)
2. High risk that’s considered unacceptable (red)
3. Moderate risk that may or may not be acceptable (yellow)
Let’s say your company is trying to determine whether it should install additional controls to prevent waste leaking during transport via pipeline to a storage location.
Let’s say a supplier failure recently caused a problem at your company, and you’ve been tasked with identifying high-risk suppliers that need improvement (or that need to go altogether).
Here we’ll use an example of a pathogenic hazard at a step where you’re trying to decide whether you need another critical control point (CCP).
Our PROMISE: Quality Digest only displays static ads that never overlay or cover up content. They never get in your way. They are there for you to read, or not.
Quality Digest Discuss
About The Author
Rachel Tracy
© 2022 Quality Digest. Copyright on content held by Quality Digest or by individual authors. Contact Quality Digest for reprint information.
“Quality Digest" is a trademark owned by Quality Circle Institute, Inc.