Cost for QD employees to rent an apartment in Chico, CA. $1,200/month. Please turn off your ad blocker in Quality Digest
Our landlords thank you.
Bryan Christiansen
Published: Wednesday, May 10, 2023 - 12:02 With so many assets and projects to think about, facilities management is a huge and complex field. It’s easy to lose focus. Luckily, there’s a simple and easy fix for this problem—facility management KPIs (key performance indicators). Outlining and tracking the most important ones will help you focus on the critical measures that drive actual business success. In this article, we review the top 10 KPIs facility managers should have on their radar, and show how to apply them in practice. Managers commonly use “metrics” and “KPIs” interchangeably, yet the two terms differ fundamentally. 
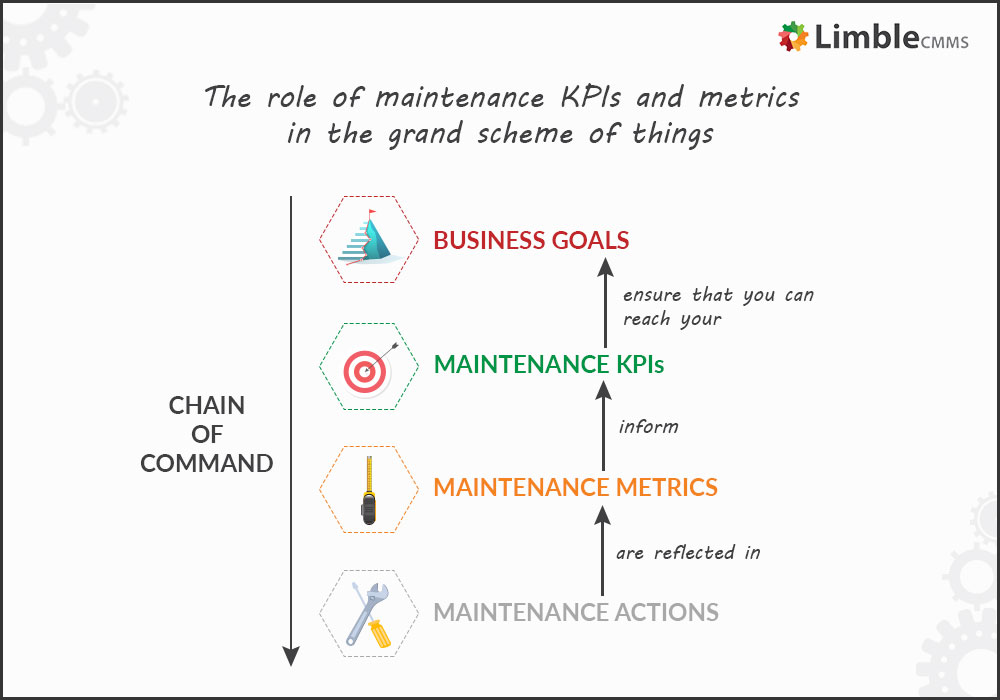
When we discuss performance metrics, we’re talking about useful information that gives a snapshot of a specific issue. For example, how often a building’s elevator is out of order, forcing people to use the stairs. Apart from summarizing the work done, this is not a KPI. When we use the term KPI, we’re talking about critical measurements linked to a business strategy, such as cutting operational costs or increasing efficiency, indicating whether it’s on track to achieve its stated objectives. KPI No. 1: Planned maintenance vs. reactive maintenance ratio Planned maintenance is the work you regularly plan and schedule to prevent assets from operating poorly or breaking down. In contrast, reactive maintenance is the work you perform after and in response to an asset breakdown. In a well-structured and executed asset maintenance program, you should have significantly more planned maintenance tasks than reactive ones. If this ratio begins to level out with a trend toward reactive maintenance, you likely have underlying problem areas needing to be identified and resolved. Likely causes may be poor maintenance planning, lack of proactive maintenance, or old assets nearing the end of their useful life. Leave such a trend going for too long and you’ll be doing less planned maintenance and more firefighting, leading to a vicious cycle of increasing costs and downtime. KPI No. 2: Work order completion time Work order resolution time is a useful KPI for tracking the efficiency and effectiveness of your internal processes. It’s also a good indicator of the adequacy of your maintenance resources and strategy. For a facility manager, assets that are unavailable for extended periods can lead to safety issues and loss of revenue. It’s also evidence of competencies that may be lacking on your team. An increase in the time it takes to resolve maintenance work orders commonly results from: While this KPI will vary month to month due to sickness or lack of spare parts, monitoring its trend will help you notice warning signs and point to actions you can take to turn things around. In many cases, the simplest solution is to implement modern work order software. KPI No. 3: Preventive maintenance compliance A well-functioning preventive maintenance program requires more than just a favorable ratio of planned-to-reactive maintenance. Preventive maintenance tasks should be completed at the correct frequency and by the scheduled date. Preventive maintenance compliance, also known as schedule compliance, is an important facility management KPI that helps you measure the effectiveness of your maintenance program. A low schedule compliance rate is frequently caused by the maintenance team’s inadequate access to: Regularly missing preventive maintenance tasks will, sooner or later, lead to an increased number of unexpected breakdowns, resulting in higher operating and capital costs. KPI No. 4: Equipment downtime Businesses don’t buy assets to let them sit idle. Therefore, if an asset becomes unavailable, it must return to service quickly or risk: Measuring the time between someone reporting an incident and its rectification provides insight into the effectiveness of your work order process. An increasing trend in unplanned downtime should be investigated as soon as possible. Conversely, if you’ve taken on new contractors or invested heavily in training, spares, or tooling, an improvement in this KPI will provide good justification for your investment. KPI No. 5: Spare parts turnover rate Holding a high volume of spare parts on your shelves for extended periods ties up capital and is grossly inefficient. It also exposes you to spare obsolescence, theft, or deterioration risk. The alternative doesn’t sound particularly appealing, either. If you’re not holding enough spares, you’re bound to overspend on emergency purchases while absorbing excessive asset downtime. The spare parts turnover rate is a measure of how quickly you use and replenish your spares. It’s calculated by dividing the cost of goods sold by your average inventory value. Most industries have turnover rates between 5 and 10. Imagine the cost of goods sold in one period was $150,000, and your average inventory value for that same period was $30,000. In this scenario, your spare parts turnover ratio is 5. KPI No. 6: Total facilities management costs Understanding the total monthly/quarterly/yearly cost of keeping your building safe and operational provides two opportunities: If you see a sudden change in this figure, for either better or worse, it’s worth drilling down to understand the cause. Modern computerized maintenance management system (CMMS) solutions will enable deep data granularity, splitting maintenance costs into different categories like: With Limble CMMS, you can drill down into each of these categories, helping you pinpoint the areas that eat most into your facility maintenance budget. KPI No. 7: Utility costs per m² or ft² Measuring utility costs per square foot, square meter, or other area allows you to see the facility’s power, water, and other utility usages while measuring asset efficiency, maintenance effectiveness, and user habits. Capturing the rise and fall of these cost cycles throughout the year gives a facility manager insight into the tactical moves required to improve sustainability while saving operating costs. For example: KPI No. 8: Space utilization rates Space utilization KPIs tell you: Above is a quick example of how to calculate the space utilization rate, using a classroom as an example. The same principle can be applied to most other types of facilities. Knowing your space utilization rate and occupancy enables strategic decisions about the amount of space required and whether to increase or divest holdings, while also informing actions to improve client or employee use. KPI No. 9: Employee turnover rate This KPI measures employee satisfaction with their workplace. Top employers understand that becoming an employer of choice guarantees a steady stream of highly skilled and capable employees to choose from. Facility managers that have been affected by labor shortages have learned to take this KPI very seriously. Given the necessary recruitment and training costs, retaining employees is far cheaper than replacing them. A high employee turnover rate also leaves a skill vacuum and lowers team morale, seriously affecting business or facility operations. You should look at both your monthly and annual turnover rates. Within the KPI, it’s also important to distinguish between those leaving voluntarily and those who leave through retirement, redundancy, or firing. If the number of voluntary notices begins to climb, or your KPI is higher than the industry average, you have a problem with culture and engagement that requires your attention. KPI No. 10: Customer satisfaction rates As a facility manager, knowing how your clients perceive and use your facility is central to optimizing their experience. Most customers want professional and seamless service. Anything that prevents good service causes friction, reducing satisfaction and trust over time. Doing regular surveys and reading online reviews is one way of gauging client satisfaction. Other ways include analyzing data that measure a client’s frequency of use, speed of customer handling, ease of navigation, and safety. Don’t be afraid of negative feedback and complaints. They’re uncomfortable, but they also present a quick way to improve your internal processes. Measuring client satisfaction rates will help you keep your facility clean, welcoming, professional, and easy to use. This will have a positive effect on the client’s perception, engagement, and spending. When you start implementing these facility management KPIs, remember two important points: • Don’t use too many or you’ll lose focus. Choose five to eight KPIs that are most in line with your business goals. The easiest way to ensure the accuracy of your maintenance metrics and KPIs is to implement a modern CMMS like Limble. You get access to features and benefits like: Defining and tracking KPIs that are crucial for your facility is the best way to ensure your actions align with strategic business objectives. And there’s no better way to do that than with capable CMMS software. First published April 5, 2023, on the Limble blog. Quality Digest does not charge readers for its content. We believe that industry news is important for you to do your job, and Quality Digest supports businesses of all types. However, someone has to pay for this content. And that’s where advertising comes in. Most people consider ads a nuisance, but they do serve a useful function besides allowing media companies to stay afloat. They keep you aware of new products and services relevant to your industry. All ads in Quality Digest apply directly to products and services that most of our readers need. You won’t see automobile or health supplement ads. So please consider turning off your ad blocker for our site. Thanks, Bryan Christiansen is the founder and CEO of Limble CMMS. Limble is a modern, easy-to-use mobile CMMS software that takes the stress and chaos out of maintenance by helping managers organize, automate, and streamline their maintenance operations.Ten Facility Management KPIs You Should Start Tracking Today
Focus on critical measures that drive actual business success
Key performance indicators vs. facilities management metrics
• Approval bottlenecks
• Poor inventory control or supervision
• Increasing delivery times for goods
• An overwhelmed or undertrained maintenance workforce
• Assets
• Tooling
• Parts
• Effective maintenance training
• Other necessary resources
• Client dissatisfaction
• Lost revenue
• Safety incidents
• It allows you to benchmark your operation against industry best practices
• It helps you identify cost trends over time
• Energy
• Labor
• Parts
• Overhead
• Contractor costs
• Increasing the preventive maintenance frequency on filters, fans, and heat exchangers to lower running costs
• Installing low-energy LEDs
• Implementing sensors to turn off lights, heating, and cooling when users vacate a room
• Teaching tenants and other building users about sustainable practices they can implement in their daily lives and work
• The proportion of time people use a space compared to its availability
• The number of people occupying it compared to its capacityUse maintenance software to track your KPIs and performance metrics
• Make sure the resources and administrative input needed to monitor these KPIs don’t hinder your overall productivity.
• A single source of truth: The output KPIs come from a single point of truth. All statistics and asset management actions are based on the same data, shared by all departments.
• Data saved in the cloud: Your asset management data are regularly backed up, providing strong data security. Furthermore, you get quick access to data via any mobile device.
• Data integrity: The maintenance software ensures that any data you enter meet the preset data formats, standards, and naming conventions.
• Custom reports: On top of the data you enter manually, Limble CMMS will automatically track dozens of different data points you can use to build custom reports. Once built, you can set them to generate automatically.
• Data granularity: High-level data are great for tracking trends but bad for identifying causes. When we created Limble, we made sure users could drill down into their data to find the exact information they are looking for.
Our PROMISE: Quality Digest only displays static ads that never overlay or cover up content. They never get in your way. They are there for you to read, or not.
Quality Digest Discuss
About The Author
Bryan Christiansen
© 2023 Quality Digest. Copyright on content held by Quality Digest or by individual authors. Contact Quality Digest for reprint information.
“Quality Digest" is a trademark owned by Quality Circle Institute, Inc.
Comments
Way too much
This is way too much for 99% of organizations, in my opinion.