Featured Product
This Week in Quality Digest Live
Lean Features
Akhilesh Gulati
To solve thorny problems, you can’t have either a purely internal or external view
Katie Rapp
The future of manufacturing is about making processes more efficient
Bryan Christiansen
And when to hire one
Tom Taormina
How to transition from a certified quality professional to an expert in business management systems
Chip Reavley
Well-designed solutions lower costs and increase revenue

More Features

Lean News
Quality doesn’t have to sacrifice efficiency
Weighing supply and customer satisfaction
Specifically designed for defense and aerospace CNC machining and manufacturing
From excess inventory and nonvalue work to $2 million in cost savings
Tactics aim to improve job quality and retain a high-performing workforce
Sept. 28–29, 2022, at the MassMutual Center in Springfield, MA
Enables system-level modeling with 2D and 3D visualization, reducing engineering effort, risk, and cost
It is a smart way to eliminate waste and maximize value
Simplified process focuses on the fundamentals every new ERP user needs

More News

Gwendolyn Galsworth

Lean

Speed Isn’t Everything, Part 1

Lean and visual defined

Published: Monday, October 3, 2016 - 15:40

Summer with its balmy evenings and long talks with good friends, lemonades in hand, is over. Let’s set the groundwork for this new season and get our definitions in place, once again—the difference between visual and lean.

What is lean?

Technically speaking, lean is a predetermined set of improvement tools that squeeze time and space out of the route that work (the product) follows as it moves through a company’s operational landscape and gains value.

Whether you call this route the critical path or the value stream, lean’s purpose is to identify and then eliminate barriers and constraints in that route. The shorthand for this is the “Seven Deadly Wastes,” which are defects, delays, overprocessing, motion, overproducing, excess inventory, and excess material handling—plus all the opportunities we miss because our resources are caught up in the wastes themselves.


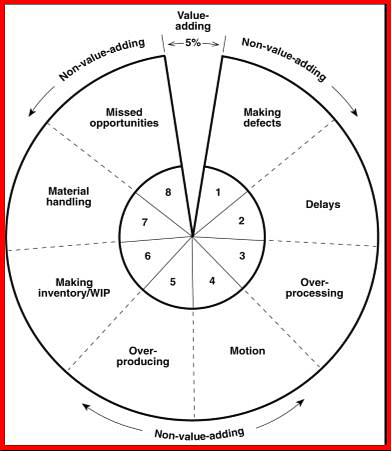
Image 1: The Seven Deadly Wastes + 1

Time is lean’s macro metric, and its corollary is speed. The key methods in the lean toolbox are: standard work, quick changeover, level material consumption, and pull. These four tools are so tightly aligned as to be nested in their logic and outcomes, with a powerful impact on all four key performance indicators: safety, quality, cost, and on-time delivery.

Today, lean has become a wide mix of improvement tools and practices that make it, for some, hard to find lean’s beating heart. There are those who regret the blurring of the sharp edges that lean had in its early days. Others celebrate the expansion.

What is the visual workplace?

The “visual workplace”(or “visual” for short) is an improvement methodology that focuses on the struggle that results from information that is missing, incorrect, or incomplete at the workplace. In a previsual workplace, these information deficits are chronic but rarely noticed—because they are invisible. Missing answers simply aren’t there; they’re an invisible enemy. The visual workplace is as different and distinct from lean as information is from time. Both time and information are indispensable parts of the life of every company—but they are not the same, so the methodology for improving each is distinctly and most definitely different.

When a company embarks upon the visual journey, it hunts down the unseen enemy in the only way it can: by identifying its footprint. I call that footprint motion, one of the seven deadly wastes, and the one that I focus on to define the struggle caused by missing answers in all its thousands and perverse forms: searching, looking for, counting and counting again, wandering, wondering, waiting for information, asking questions, asking again, being interrupted to answer the same question... again.

Motion in the previsual workplace is an insidious array of micro transactions that the unaware barely notice and so never think to eliminate. Not so for a workforce that has learned how to think visually—how to see motion and know that it is always caused by missing information. Visual thinkers also know that the way to remove an information deficit (and the motion it causes) is to turn that missing answer into a visual device. The device displays the answer for anyone and everyone who needs it, without speaking a word.

The most complete example of this outside the workplace is our system of roads and highways. In the United States alone, 150 million cars are on the road every day—150 million killing machines. Yet relatively few people die, proportionally only the tiniest fraction of the sum, thanks to visual information sharing.

In my next article, I’ll put more meat on these bones as we explore highway visual devices further and build visuality’s definition.

Discuss

About The Author

Gwendolyn Galsworth’s picture

Gwendolyn Galsworth

Gwendolyn Galsworth, Ph.D., has been implementing visuality for more than 30 years. She’s focused on codifying the visual workplace concepts, principles, and technologies into a single, coherent sustainable framework of knowledge. Galsworth founded Visual Thinking Inc. in 1991, and in 2005 she launched The Visual-Lean Institute where in-house trainers and external consultants are trained and certified in the Institute’s nine core visual workplace methods. Two of the seven books Galsworth has written received the Shingo Research and Professional Publication Award.