
Photo by Ludovic Migneault on Unsplash
Social Sharing block
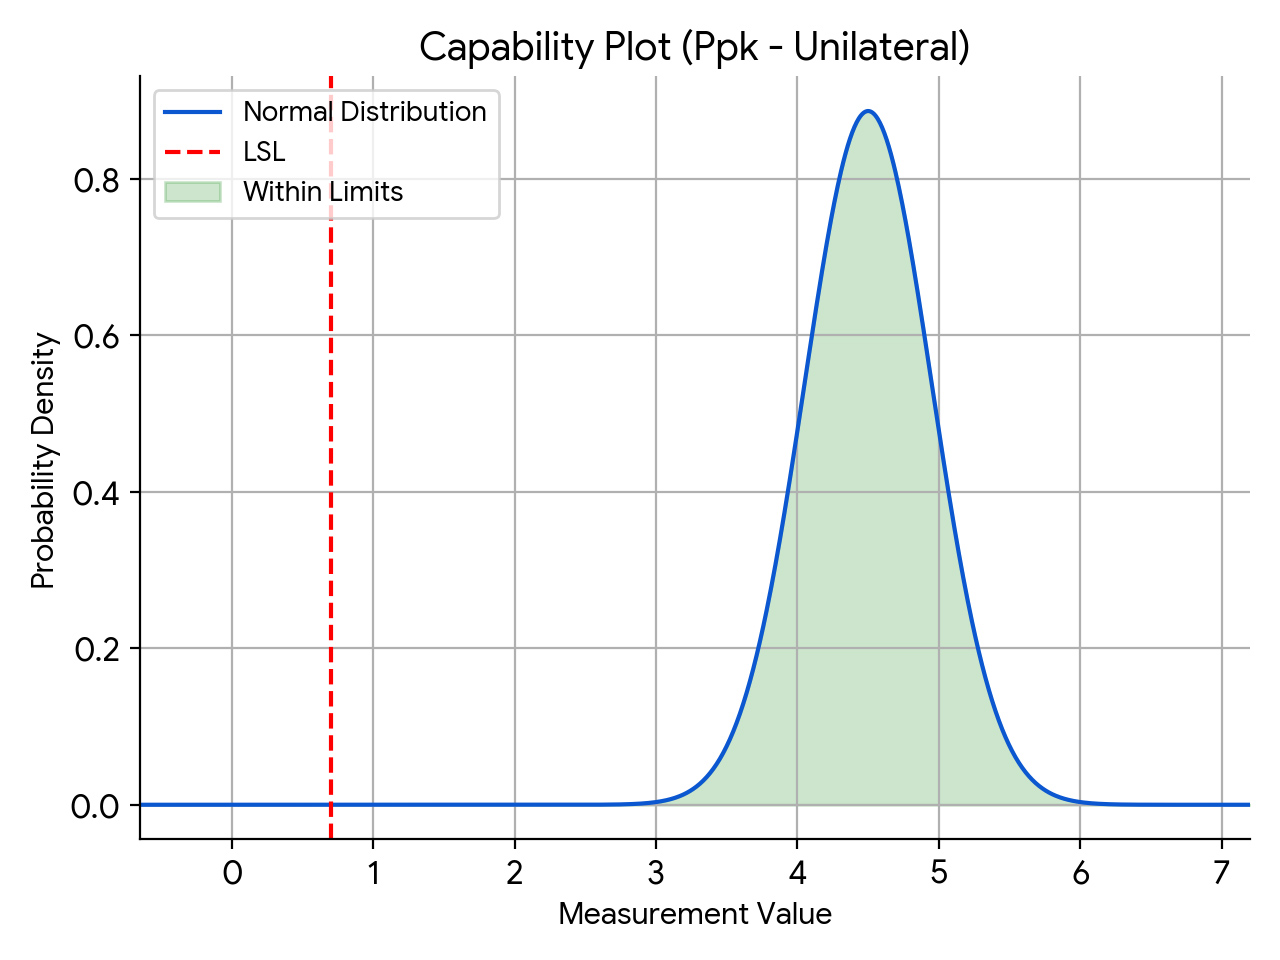
In this article, I’m looking at the relationship between capability index (Cpk or Ppk) and tolerance intervals. The capability index is tied to the specification limits, and tying this to the tolerance interval enables us to use the confidence/reliability statement allowed by the tolerance interval calculation.
|
ADVERTISEMENT |
Consider the following scenario:
A quality engineer is tasked with assessing the capability of a sealing process. The requirement the engineer is used to is that the process capability index, Ppk, must be greater than or equal to 1.33. The engineer is accustomed to using 30 as the sample size.
But what does this really tell us about the process? Is 1.33 expected to be the population parameter? If so, does testing 30 samples provide us with this information? The capability index calculated from 30 samples is only the statistic, and not the parameter.
…
Comments
Interesting. Is there a…
Interesting. Is there a reference for the relationship used: Ppk required = k1/3? Thanks.
Reference
Hello Subha,
A good reference is https://www.astm.org/f3172-15r21.html.
Thanks,
Harish
Jose, Cpk, Ppk and…
Jose,
Cpk, Ppk and tolerance interval statistics are calculated from samples. The samples may not come from a process in statistical control. Therefore the calculated statistics may not be reliable. Statistical control should first be assessed by process behavior charts.
Best,
Stan Alekman
Hi Stan, I agree. My post…
Hi Stan,
I agree. My post was not necessarily about that aspect though.
Thanks,
Harish
Cpk linked to tolerance intervals
You have neglected to mention that the index is only valid following an assessment of the stability of the underlying process! This is not a given and requires constancy of purpose and effort.
Confidence interval for process capability metrics
Davis Bothe's book Measuring Process Capability has the confidence interval formulas for process capability metrics. The easiest one is for Cp because you only have to estimate one parameter (the population standard deviation). The other intervals are wider but calculating the Cp interval is enough to show that to obtain a useful confidence interval (one sufficiently narrow to indicate a unique interpretation over its range) you need a very large sample size. For 10% precision with 95% confidence, i.e. P(0.9*Cp_hat < Cp < 1.1*Cp_hat) = 0.95, you need a sample size of about 200 units. Suppose a sample of 200 units delivers estimated Cp Cp_hat = 1.5. The 95% confidence interval (with 10% precision) will be P(1.35 < Cp < 1.65) = 0.95. That's a huge range of possible Cp values considering everything interesting happens between Cp = 1 (awful) and Cp = 2 (spectacular). Process capability with small sample sizes, e.g. n = 30, is delusional unless all of the metrics are very large and you're confident that all of the assumptions (e.g. normality, single stable process, etc.) are satisfied.
If the process capability data are collected under SPC protocol (as they're supposed to be) and there is evidence that the process mean is unstable (Pp << Cp), then you can't use Bothe's simple confidence intervals. In this case there will be two standard deviations - the within-subgroup and the between-subgroup standard deviations - and the confidence intervals have to be determined with appropriate degrees of freedom weighting.
In general, Harish is correct that process capability (with confidence intervals), normal tolerance intervals, and variables sampling plans are all about the same thing - characterizing the proportion defective with respect to specification limits and their results will converge.
To Stan Alekman and Mike M: It's good to see you're keeping track of these things. P.
So much math, so little insight
Capability indices were never about defect rates. They were about reducing variation. Period. (Read Sullivan, L. P., “Reducing Variability: A New Approach to Quality”, Quality Progress, July 1984 and “Letters” Quality Progress, April, 1985). The ‘movement’ to conflate variation with defect rates was a misguided attempt to add mathematical precision - and therefore complexity - to provide an oil slick of professionalism. It also fed the lazy executives need for a ‘bright line’: yes or no; no thinking allowed. Reducing variation to a single number? The oxymoron is an embarrassment o our profession. It is long past time to abandon this statistics; alchemy and revert to our roots: plot your data, think about your data. A control chart and a Multi-Vari with spec limits is better. These provide insight. Or have we willfully forgotten the lessons of Shewhart, Deming, Seder, Youden and Ott?
Add new comment