Social Sharing block
Perhaps the reader recognizes d2 as slang for “designated driver,” but quality professionals will recognize it as a control chart constant used to estimate short-term variation of a process. The basic formula shown below is widely used in control charting for estimating the short-term variation using the average range of small samples. But what exactly is d2 and why should we care?
![]()
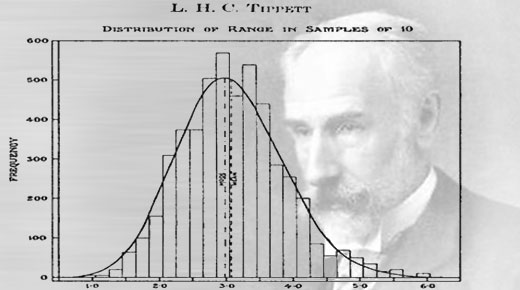
L.H.C. Tippett
To find some answers to this question, we need to consult the 1925 work of L.H.C. Tippett.1 Leonard Henry Caleb Tippett was a student of both Professor K. Pearson and Sir Ronald A. Fisher in England. Tippett pioneered “Extreme Value Theory,” and while advancing the ideas of Pearson’s 1902 paper of Galton’s Difference Problem,2 he noted that the prior work of understanding the distribution of the range for a large number of samples was deficient.
Tippett proceeded to use calculus and hand calculations to integrate and determine the first, second, third, and fourth moments of the range for samples drawn from a standard normal distribution. That is, he calculated the mean, variance, skewness, and kurtosis for sample sizes of size two through 1,000 by hand.
…
Add new comment