{domain:"www.qualitydigest.com",server:"169.47.211.87"} Skip to main content

User account menu
Main navigation
  • Topics
    • Customer Care
    • FDA Compliance
    • Healthcare
    • Innovation
    • Lean
    • Management
    • Metrology
    • Operations
    • Risk Management
    • Six Sigma
    • Standards
    • Statistics
    • Supply Chain
    • Sustainability
    • Training
  • Videos/Webinars
    • All videos
    • Product Demos
    • Webinars
  • Advertise
    • Advertise
    • Submit B2B Press Release
    • Write for us
  • Metrology Hub
  • Training
  • Subscribe
  • Log in
Mobile Menu
  • Home
  • Topics
    • 3D Metrology-CMSC
    • Customer Care
    • FDA Compliance
    • Healthcare
    • Innovation
    • Lean
    • Management
    • Metrology
    • Operations
    • Risk Management
    • Six Sigma
    • Standards
    • Statistics
    • Supply Chain
    • Sustainability
    • Training
  • Login / Subscribe
  • More...
    • All Features
    • All News
    • All Videos
    • Contact
    • Training

Drag-and-Drop Data Analytics Get a New Tool

System lets nonspecialists use machine-learning models to make predictions for medical research, sales, and more

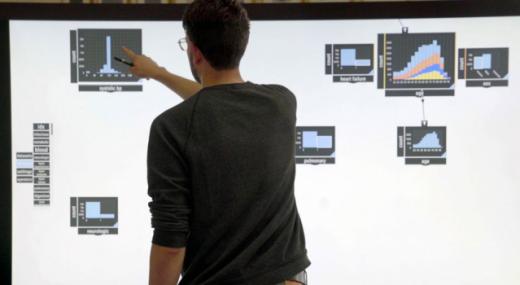
For years, researchers from MIT and Brown University have been developing an interactive system that lets users drag-and-drop and manipulate data on any touchscreen, including smartphones and interactive whiteboards. Now, they’ve included a tool that instantly and automatically generates machine-learning models to run prediction tasks on that data. Image: Melanie Gonick

Rob Matheson
Thu, 07/25/2019 - 12:02
  • Comment
  • RSS

Social Sharing block

  • Print
Body

In the Iron Man movies, Tony Stark uses a holographic computer to project 3D data into thin air, manipulate them with his hands, and find fixes to his superhero troubles. In the same vein, researchers from MIT and Brown University have now developed a system for interactive data analytics that runs on touchscreens and lets everyone—not just billionaire tech geniuses—tackle real-world issues.

ADVERTISEMENT

For years, the researchers have been developing an interactive data-science system called Northstar, which runs in the cloud but has an interface that supports any touchscreen device, including smartphones and large interactive whiteboards. Users feed the system datasets, and manipulate, combine, and extract features on a user-friendly interface, using their fingers or a digital pen, to uncover trends and patterns.

 …

Want to continue?
Log in or create a FREE account.
Enter your username or email address
Enter the password that accompanies your username.
By logging in you agree to receive communication from Quality Digest. Privacy Policy.
Create a FREE account
Forgot My Password

Add new comment

Image CAPTCHA
Enter the characters shown in the image.
Please login to comment.
      

© 2025 Quality Digest. Copyright on content held by Quality Digest or by individual authors. Contact Quality Digest for reprint information.
“Quality Digest" is a trademark owned by Quality Circle Institute Inc.

footer
  • Home
  • Print QD: 1995-2008
  • Print QD: 2008-2009
  • Videos
  • Privacy Policy
  • Write for us
footer second menu
  • Subscribe to Quality Digest
  • About Us
  • Contact Us