{domain:"www.qualitydigest.com",server:"169.47.211.87"} Skip to main content

User account menu
Main navigation
  • Topics
    • Customer Care
    • FDA Compliance
    • Healthcare
    • Innovation
    • Lean
    • Management
    • Metrology
    • Operations
    • Risk Management
    • Six Sigma
    • Standards
    • Statistics
    • Supply Chain
    • Sustainability
    • Training
  • Videos/Webinars
    • All videos
    • Product Demos
    • Webinars
  • Advertise
    • Advertise
    • Submit B2B Press Release
    • Write for us
  • Metrology Hub
  • Training
  • Subscribe
  • Log in
Mobile Menu
  • Home
  • Topics
    • 3D Metrology-CMSC
    • Customer Care
    • FDA Compliance
    • Healthcare
    • Innovation
    • Lean
    • Management
    • Metrology
    • Operations
    • Risk Management
    • Six Sigma
    • Standards
    • Statistics
    • Supply Chain
    • Sustainability
    • Training
  • Login / Subscribe
  • More...
    • All Features
    • All News
    • All Videos
    • Contact
    • Training

GaiaLens Launches Innovative User Interface Tackling Common ESG Data Complaints

Extends focus on data-driven explainability and adds customizability

Wed, 07/20/2022 - 11:58
  • Comment
  • RSS

Social Sharing block

  • Print
Body

(GaiaLens: London) -- GaiaLens, the AI-driven environmental, social, and corporate governance (ESG) analytics platform that takes a purely quantitative approach to ESG scoring, has gone live with new versions of its three main dashboards offering Portfolio Level analysis, Stock Level analysis, and a new sophisticated Screening Tool designed to aid portfolio construction.

ADVERTISEMENT

The interfaces showcase GaiaLens’ core benefits, which are “explainability,” “objectivity,” and “customizability,” addressing some of the criticisms of existing ESG ratings, such as their lack of explainability and subjectivity.

The Portfolio dashboard enables investors to upload a portfolio in seconds and compare its ESG performance to a benchmark of their choosing, such as the S&P 500. Users can then drill down into their portfolio to find out what is driving its overall portfolio score. The dashboard also flags up any ESG news incidents that are taking place concerning their portfolio companies.


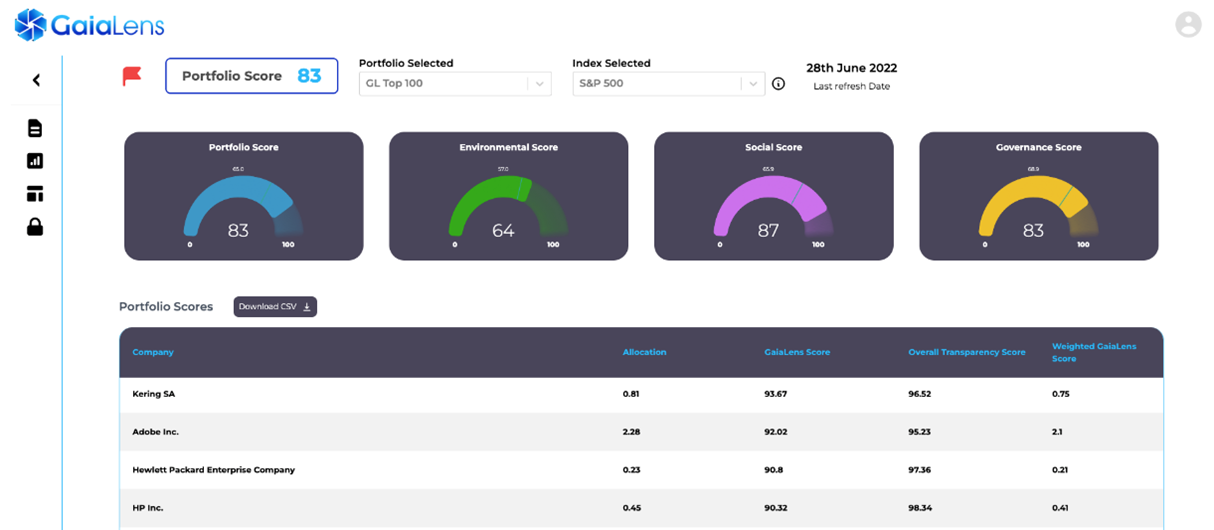
Figure 1: Portfolio Level dashboard

 …

Want to continue?
Log in or create a FREE account.
Enter your username or email address
Enter the password that accompanies your username.
By logging in you agree to receive communication from Quality Digest. Privacy Policy.
Create a FREE account
Forgot My Password

Add new comment

Image CAPTCHA
Enter the characters shown in the image.
Please login to comment.
      

© 2025 Quality Digest. Copyright on content held by Quality Digest or by individual authors. Contact Quality Digest for reprint information.
“Quality Digest" is a trademark owned by Quality Circle Institute Inc.

footer
  • Home
  • Print QD: 1995-2008
  • Print QD: 2008-2009
  • Videos
  • Privacy Policy
  • Write for us
footer second menu
  • Subscribe to Quality Digest
  • About Us
  • Contact Us