Social Sharing block
In the words of my friend and colleague Larry Loucka, “Graphs are math.”
|
ADVERTISEMENT |
Graphs often serve as effective visual process performance tools. Typically, these types of graphs fall into the metric category. As reflected in the supporting concepts of the fourth dimension of the Shingo Prize model, good metrics should:
1. Measure what matters
2. Align behaviors with performance
3. Identify cause-and-effect relationships
Real lean drives measurable operational and financial performance improvement. Typically results are enjoyed at the operational level first, and then as the transformation matures, the financial benefits follow (see figure 1).
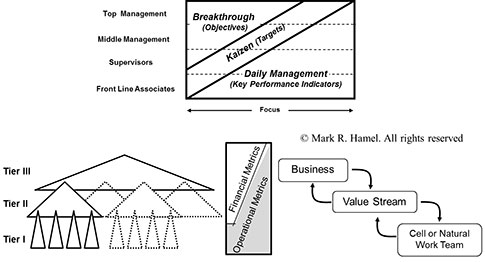
Figure 1: Measurable operational and financial performance improvement. Click here for larger image.
…
Add new comment