Inside Metrology

Quality Digest  |  01/09/2008

Quality Digest’s picture

Bio

A New Approach to Surface Profiling

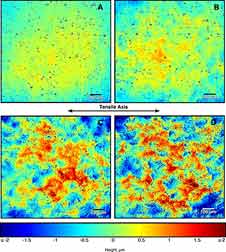
The four images (taken with scanning laser confocal microscopy) show variations in surface roughness of an aluminum alloy as produced by increasing amounts of strain: A – 1 percent, B – 4 percent, C – 8 percent and D – 12 percent.

Mark Stoudt, Joseph Hubbard and Stanley Janet, NIST


(NIST: Gaithersburg, Maryland) -- Researchers at the National Institute of Standards and Technology have developed a novel technique for measuring the roughness of surfaces that is casting doubt on the accuracy of current procedures. Their results announced in a forthcoming paper could cut development costs for automakers as they design manufacturing tools for new, fuel-efficient, lightweight alloys.

Surface roughness is a key issue for auto manufacturers and other industries that use sheet metal, one that goes far beyond simple cosmetics. Faint striations and other marks that appear when metal is shaped can indicate residual stresses that may cause the part to fail later on. They also lead to extra wear and early retirement for the expensive stamping dies used to form sheet metal into fenders and other body parts (a typical production die can cost $2 million or more.) Measures of surface roughness feed into models that predict friction and the metal’s “springback”—the amount it will unbend after being stamped. Springback has to be known and controlled to build accurate dies for complex metal shapes. A significant cost in introducing new lightweight alloys for cars is the trial-and-error process needed to develop a new set of dies for each new alloy.

Conventionally, roughness is measured with a profilometer, an instrument with a probe like a high-tech phonograph needle that is tracked in a line across the test surface to record the peaks and valleys. The process is repeated several times at intervals across the test surface, and the results are averaged into a “roughness” figure. (New noncontact instruments use optical probes, but the idea is the same.) But NIST researchers have found that these measures may be misleading—as both measurement uncertainties and statistical errors are compounded when the 2-D lines are extrapolated to the entire surface.

NIST’s approach uses data from a scanning laser confocal microscope (SLCM), an instrument that builds a point-by-point image of a surface in three dimensions. The data from a single SLCM image—representing an area of about 1000 X 800 micrometers by 20 micrometers in depth—are analyzed using mathematical techniques that treat every point in the image simultaneously to produce a roughness measure that effectively considers the entire 3-D surface rather than a collection of 2-D stripes.

One early finding is that the generally accepted linear relationship between surface roughness and material deformation is wrong, at least for the aluminum alloy the group studied. The more accurate data from the 3-D analysis shows that a more complicated relationship was masked by the large uncertainties of the linear profilometers. The NIST researchers hope their new technique will lead to more accurate models of the effects of strain on new alloys and, eventually, lower development and tooling costs for metalworking industries.

For more information, visit www.nist.gov/public_affairs/techbeat/tb2008_0108.htm#rough

Discuss

About The Author

Quality Digest’s picture

Quality Digest

For 30 years Quality Digest has been bringing news and information to quality professionals. With more than 40,000 opted-in subscribers, we are the source for cutting-edge management, tools, and innovation in the field. Today, Quality Digest is completely web-based and provides daily news on the quality industry via our daily e-newsletter. Our website is a unique resource and contains all editorial from the magazine back to 1995.