Dramatic Statistics, Tragic Flaw
One of Greer Grate & Gate’s
customers, Mandible Manacle Manufacturing, makes handcuffs
and sells them to law enforcement agencies throughout the
United States and Singapore. After an unfortunate spate
of separations and failures in cuffs used to restrain criminals,
MMM has insisted on higher quality throughout its manufacturing
processes and has demanded that Greer Grate & Gate’s
components be produced with a CpK of at least 1.
For Hartford Simsack, this is a piece of cake. In fact,
he sees this as an opportunity to instruct--and hopefully
impress--his assistant, Aiden Abett. He begins by writing
formulas on a whiteboard.
The data comprise 14 samples, with sample sizes of two:
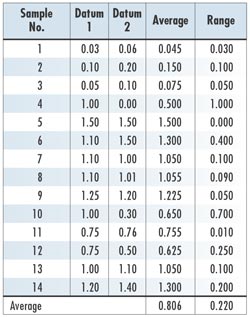
His calculations look like this:
In this case:
To calculate the CpK, Simsack explains that one should
divide the smaller Z value by three:
Simsack has no doubt impressed Abett, although the student’s
eyes have glazed over slightly. “That’s all
there is to it,” Simsack concludes.
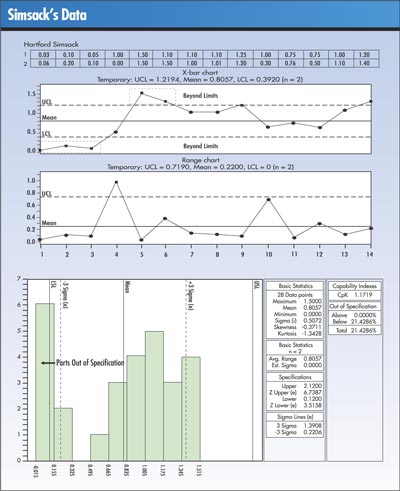
A week later, Abett brings Simsack a printout of the same
data, with the X-bar and R charts as well as the histogram
that he’s created from the data. Puzzled, he asks
Simsack to explain the points that seem out of specification.
Simsack dismisses the printout as a computer error because
“Everyone knows that a CpK of 1 or more shows that
you’re making virtually all good parts.”
Is Simsack correct in his observation?
Simsack is, of course, incorrect--again.
Arrogant enough to dismiss any obligation to check his
conclusions, Simsack failed to check the two critical assumptions
that are vital to capability studies:
 The X-bar and R chart must indicate that the process is
in control.
The X-bar and R chart must indicate that the process is
in control.
Data must conform to a normal distribution.
As the charts below indicate, Simsack’s data violate
not one but both assumptions. Unfortunately, this means
his conclusion--that a CpK of 1.17 represents a great accomplishment--is
tragically flawed, especially when the printout shows 21.4
percent of the data are out of specifications.
Michael J. Cleary, Ph.D., founder and president of
PQ Systems Inc., is a professor emeritus of management science
at Wright State University in Dayton, Ohio.
|