Like a mouse in a maze, Hartford Simsack continues to learn from his mistakes. Although these blunders have been
costly to Greer, Grate & Gate and its customer relations, Simsack is learning more about statistical process control with each. And so far, he's been able to disguise his own fault by
diffusing blame throughout the company. Of course the best way to fix blame is to hire an assistant who will absorb that blame, and Simsack has persuaded his brother-in-law,
Greer, Grate & Gate's CEO, to hire such a person. After carefully screening candidates' r�sum�s, he recommends hiring Ima Dormat, a diffident woman with very little experience in SPC or
quality assurance. The first lesson that Simsack imparts to his new assistant relates to process control. He assures her that she doesn't need to understand the reasons for
keeping processes stable or in control because he will take care of that himself. He teaches her how to do X-bar and R charts for a process and reminds her again of the critical importance of
stability. "Above all, be sure the process is in control," he insists. 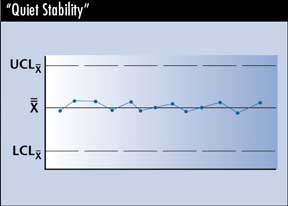 Because her instruction relies only on the limited knowledge that Simsack has imparted to her, Dormat brings every chart to him for approval. Simsack's
main role, now that he has an assistant, is to verify control charts. He doesn't have to leave his office to do this, so he's been able to spend more time at his computer, installing and
testing new video games. Because her instruction relies only on the limited knowledge that Simsack has imparted to her, Dormat brings every chart to him for approval. Simsack's
main role, now that he has an assistant, is to verify control charts. He doesn't have to leave his office to do this, so he's been able to spend more time at his computer, installing and
testing new video games.
On the other hand, Dormat is beginning to get discouraged. Each time she brings a
control chart to her mentor, he lectures her about every point that lies beyond the control limits. This doesn't help her to understand stability, but instead reinforces her lack of confidence. Dormat knows that when there are points too close to, or outside of, control limits, Simsack takes out his unhappiness on her. On the other hand, when she brings
charts in which most of the X-bars lie close to the center line, he gives his grudging approval, without lecturing her. Dormat may not be assertive, but she doesn't lack imagination.
The next time she brings a chart to her boss for approval, she feels confident that he'll like it. The data points hardly vary from the mean. This is a fine, boring chart,
she tells herself, with little movement up or down. Dormat likes that kind of quiet stability. "Sort of like me," she reflects.
When he sees the chart, Simsack is pleased at the discernment that his new assistant has brought to the analysis, knowing that she depends on him completely
for the final interpretation of the chart and is not likely to know anything beyond what little information he gives her. He likes that quiet surge of power, and he gives
her grudging praise for her good work. Is Simsack's approval justified because every X-bar is within the control limits?
a. Yes, this process is in control because all of the data points lie within the control limits. If a few have been eliminated, this won't affect the outcome in any substantial way.
b. No, Simsack is dead wrong about this one. The process is clearly out of control. 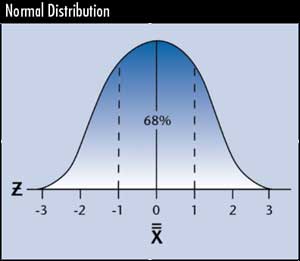 (answer) (answer)
The answer is no. Sometimes things are a little too neat for their own good,
and that's the case with this data. When a process is in control, one can expect the X-bars to form a normal distribution between the upper and lower control
limits. This is based on the central limit theorem, a concept that you can learn more about by downloading Quality Gamebox from www.pqsystems.com. If the
data formed a normal distribution, the X-bars would appear as follows: By moving plus and minus one standard deviation in a normal distribution, one can
expect to find about 68 percent of the X-bars. In the chart that Dormat brought to Simsack, 100 percent of the X-bars lie within plus and minus one standard
deviation. The Greer, Grate & Gate chart reflects a situation that seems too good to be true, and in fact it is.
The central limit theorem notwithstanding, there's a number of ways that such a pattern is possible. If you know how this can be, e-mail me an explanation at mcleary@qualitydigest.com . About the author
Michael J. Cleary, Ph.D., is professor emeritus, Wright State University, and founder of PQ Systems Inc. He has published articles on quality management and
statistical process control in a variety of academic and professional journals. E-mail him at mcleary@qualitydigest.com . |