Crossroads or Crisis?
Michael J. Cleary, Ph.D.
mcleary@qualitydigest.com
Recurring ISO 9001 audits can
be seen as challenges or opportunities. The Chinese characters
for "crisis" include "opportunity,"
illustrating the two-edged sword that is "challenge."
To Hartford Simsack, his company's upcoming audit represents
only an opportunity for a grand headache, no matter how
many times he's reminded about what he might learn from
it. Greer Grate & Gate's most recent audit reflected
several major findings--all of which made Simsack look bad.
Looking bad was what Simsack had wanted to avoid at all
costs.
During the last audit, the auditor asked Simsack about
a data set that showed how the company's defect rate increased
as the plant temperature increased. Simsack didn't respond
except with a mumble, so the auditor pressed him about analysis
of the data.
Because Simsack knew only how to use X-bar and R charts,
he insisted that the next step would be to use such charts
to determine the relationship between defects and the temperature.
When the auditor suggested that a scattergram would provide
a clearer idea of the correlation, Simsack grudgingly mumbled
that he would have his team look into scattergram usage.
Secretly, however, he felt confident that an X-bar and R
chart would serve him better--simply because he used this
statistical analysis for everything else.
 Checking
with his mentor, Dr. Stan Deviation, at the local community
college, Simsack was introduced to the concept of simple
regression and immediately loved the way the term rolled
off his tongue. Deviation pointed out that if one variable
has an effect on a second variable, the appropriate model
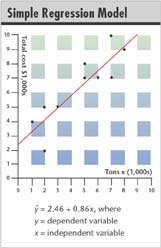
is simple regression. He drew an example depicting the relationship
between tons of coal produced and total cost. Checking
with his mentor, Dr. Stan Deviation, at the local community
college, Simsack was introduced to the concept of simple
regression and immediately loved the way the term rolled
off his tongue. Deviation pointed out that if one variable
has an effect on a second variable, the appropriate model
is simple regression. He drew an example depicting the relationship
between tons of coal produced and total cost.
He went on to explain how to determine the regression
line using "least squares." In this case, the
regression line is defined as illustrated above.
Simsack could hardly wait to showcase his newfound knowledge
in front of the auditor the following day and explain that
in order to get a best fit line, all that's required is
to square all the data and take the smallest (i.e., least)
one.
Would Simsack's explanation be considered:
a) an opportunity for continued growth in understanding?
b) yet another crisis created by his ongoing incompetence?
Unfortunately, Simsack has apparently mastered only one
aspect of the Chinese characters--that which pertains to
crisis. His ear for statistical language doesn't match his
understanding of computation.
The concept of least squares is best understood with the
following diagram:
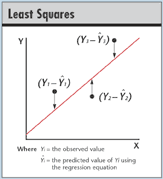
Consider the above figure with three data points that
suggest a relationship between x and y of lower left to
upper right. A line through these points minimizes the vertical
deviations .gif) .
This explains what the least squares method accomplishes.
Mathematical formulas to determine the line are: .
This explains what the least squares method accomplishes.
Mathematical formulas to determine the line are:
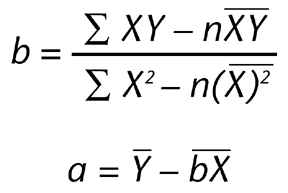
Formulas have their own language. Perhaps Simsack should
go back to studying the richer possibilities of the concept
expressed in the Chinese characters.
Michael J. Cleary, Ph.D., is a professor emeritus at Wright
State University and founder of PQ Systems Inc. He has published
articles on quality management and SPC in a variety of academic
and professional journals. Visit his Web site at www.pqsystems.com.
Letters to the editor regarding this column can be e-mailed
to letters@qualitydigest.com.
|