|
|
|
|

Today's Specials |
|
|||||||
|
|||||||
|
|||||||


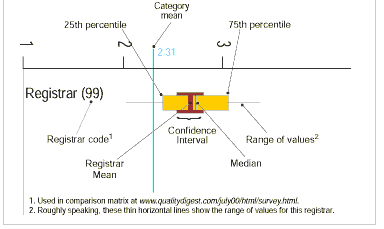
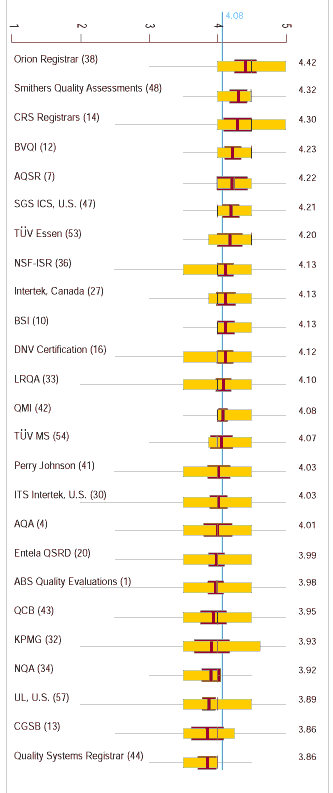
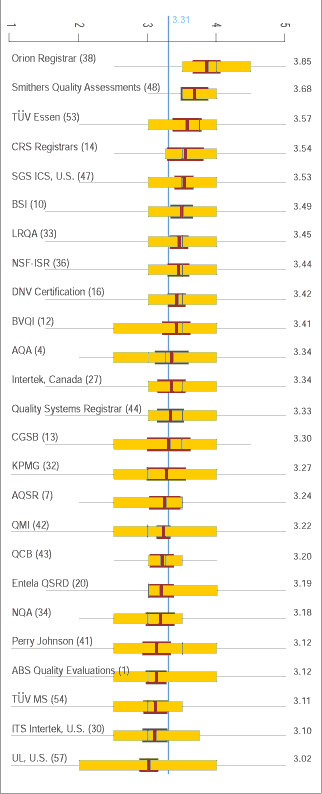
Does Your Registrar What follows are the complete results for this year's ISO 9000 Registrar Customer Satisfaction Survey. The data for each category are displayed graphically and ordered by the mean score (the vertical red bar) for each registrar moving from the higest mean to the lowest mean. See the key to category charts below. Along with the mean is the confidence interval for each registrar's mean. This is important. Roughly speaking, if the confidence interval of one registrar overlaps the confidence interval of another registrar, there is no significant difference between the two, and they can be considered as having performed equally well in this category. If you wish to take a more statistical approach to comparing two registrars, we have included a comparison matrix below each category chart based on the results of a Tamhane T2 multiple comparisons test. To compare two registrars using the matrix, find the registrar codes for each registrar (they follow the registrar's name in the category chart) and look for the intersection of those two codes in the matrix. If there is a red dot at the intersection, it means that there is a statistical difference between the two, according to this test. To determine which ranked higher, look at the relative position of thier means on the category graphic. Key to category charts
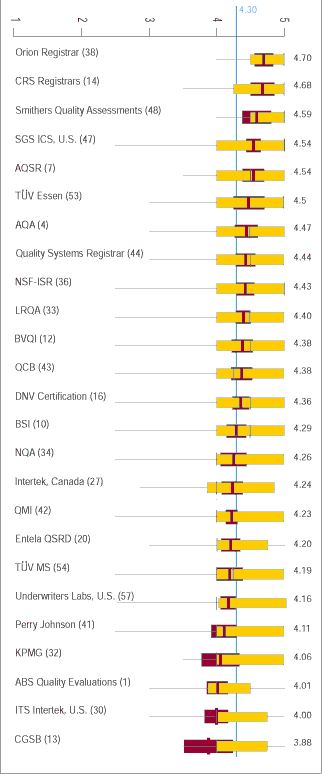
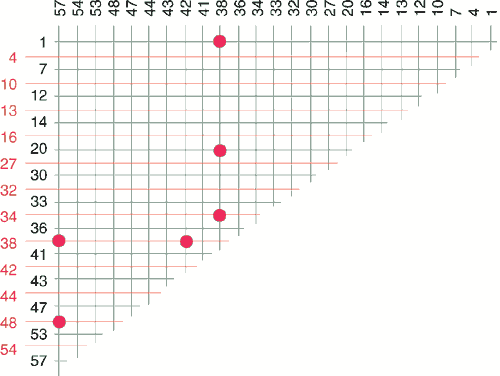
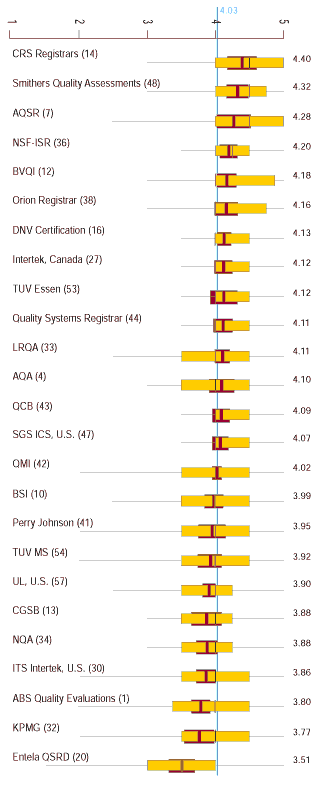
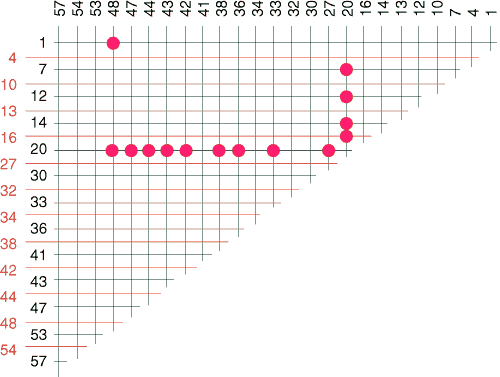
Customer Loyalty This category is made up of the responses to the two items: "I would recommend this registrar to others" and "If I had to do it again, I would choose this registrar."
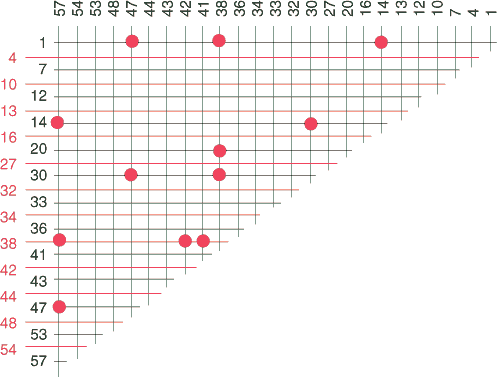
Comparison matrix. Find the code for each registrar you want to compare from the category chart above and look for the intersection in the matrix. A red dot indicates there is a statistical difference between their scores.
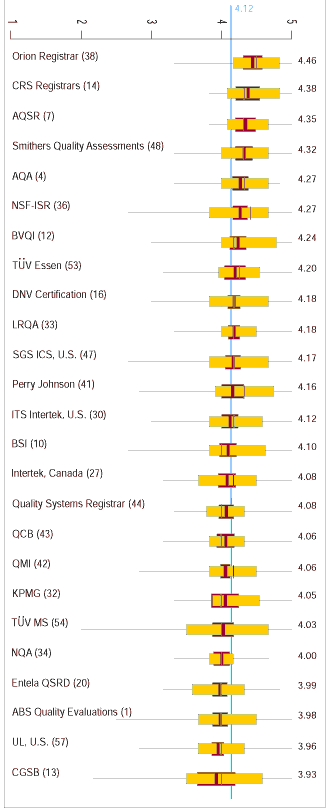
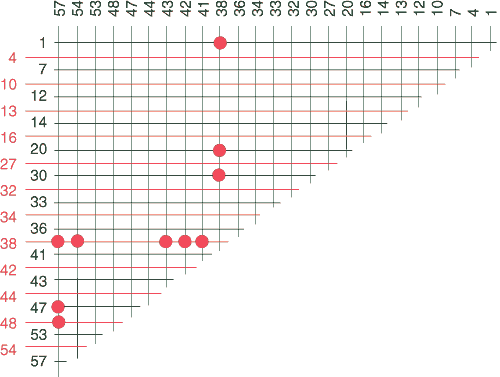
Auditor Interpersonal Relations This category is made up of items 1, 2, 3, 4, 5 and 13 from Table 2. These items seem to reflect the auditor's ability to communicate well and partner with the client.
Comparison matrix. Find the code for each registrar you want to compare from the category chart above and look for the intersection in the matrix. A red dot indicates there is a statistical difference between their scores.
Auditing Value Added This category is made up of items 7 and 9 from Table 2. These items indicate the client's perception of how well their registrar provided value-added service over and above simply auditing.
Comparison matrix. Find the code for each registrar you want to compare from the category chart above and look for the intersection in the matrix. A red dot indicates there is a statistical difference between their scores.
Consistent Interpretation This category is made up of items 10 and 11 from Table 2. These items reflect the problem of the difference in standards interpretation between auditor and client or between different auditors.
Comparison matrix. Find the code for each registrar you want to compare from the category chart above and look for the intersection in the matrix. A red dot indicates there is a statistical difference between their scores.
Administration This category is made up of items 12, 14 and 15 from Table 2. These items deal with scheduling and issuing certificates.
Comparison matrix. Find the code for each registrar you want to compare from the category chart above and look for the intersection in the matrix. A red dot indicates there is a statistical difference between their scores.
Communication This category is made up of items 6 and 8 from Table 2. These items deal with client's perception of the auditor's accessibility and the auditor's responsiveness to telephone calls and e-mail.
Comparison matrix. Find the code for each registrar you want to compare from the category chart above and look for the intersection in the matrix. A red dot indicates there is a statistical difference between their scores.
|


Menu Level Above
This Menu LeveL
Menu Level Below
Copyright 1999 QCI International. All rights reserved.
Quality Digest can be reached by phone at (530) 893-4095. E-mail: Click Here