Three Paths to Better Processes Reduce variation by identifying the statistically
significant factors in your processes.
by Mark L. Crossley For years, George Box and Genichi Taguchi have advocated reducing
process variation. Variation reduction can best be accomplished using a systematic experimentation approach, or design of experiments, to identify
those factors that are "statistically significant" in their contributions to variation. The "response" for the experiment is the standard deviation.
Consider the following experiment where three factors are examined, each at two levels (a traditional 23 experiment). In this scenario we want to minimize
variation. For each experimental condition or "run," we'll calculate the standard deviation of five repeated observations obtained during the run. Alternatively,
we could replicate the experiment five times to get a better estimate of the combined experimental and natural process variation, but that could become
very expensive. The topic of repeated observations vs. replicated experiments (as in this case) merits a whole new discussion.
In this example we want to minimize the variation of the weight of a hot-melt adhesive stick. The factors are: A Temperature of the molten material:
� = 300�; + = 335� B Fill rate: � = 300 g/sec; + = 45 g/sec C Nozzle orifice type: � = oval; + = rectangular The design matrix and data are shown in Figure 1.
Figure 1: Design Matrix and Data
|
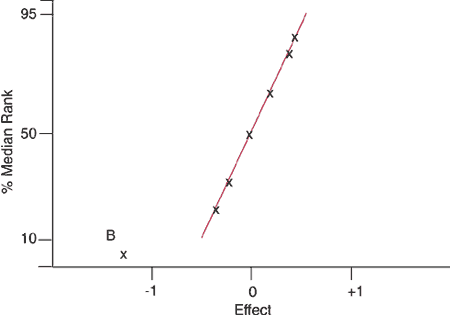
Statistical significance test methods 1. Normal probability plot.
This method involves plotting the effects (for the factor's contribution to the response) using normal probability paper. The
vertical axis is the cumulative probability density function, or its estimate, such as the percent median rank and the horizontal axis representing the effect. This
technique assumes a normal distribution, and such an assumption is supported with a single straight line. If most of the points that form a straight line fall near
zero (with respect to the horizontal axis) with exceptions falling to the right or left of the "straight" line, we conclude that the effect is statistically significant. In
the case of variation as the response, we must transform the original data in some manner to develop the effects such that they will be more normally
distributed. One of the more popular transformations is to take the log or natural log of the standard deviation and then calculate the effects. In our
example, we take the absolute value of ln S, making our objective to maximize this response, thereby minimizing the variation. The estimate for the percent
median rank (vertical axis) is determined using Benard's method.
 |
where i = the ascending order of the effect and n = the number of effects (n = 7, including all interactions).
The effect is calculated by taking the difference in the average response where the factor is set "+" and the average response when the factor is set "�." See
Figure 2 for the completed normal probability plot.
Figure 2: Normal Probability of Effects Based on |ln S|
|
As Figure 2 shows, the only significant factor in terms of variation is B. To minimize variation, we must maximize the transformed response, |ln S|. Because
the B effect is �1.20, we must set B to the � setting. The fill rate should be set at 30 g/sec. The seven effects plotted represent the three main effects, the three two-factor
interactions and the single three-factor interaction. The modest disadvantage to this method lies in the subjectivity of determining which points fall off the straight
line drawn with emphasis around the zero-effect point. 2. F-test. The F-test is based upon the distribution of sample variances. We
compute the variance of the sample standard deviations by squaring the standard deviation. We now calculate the average variance for the runs (of a
given factor column) where the factor is "�" and "+." Dividing the larger average variance by the smaller variance finds the F-statistic. Example For main effect A,
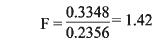
We confront the calculated F value of 1.42 with the critical F value. The numerator and denominator both have 24 degrees of freedom, which are
determined by multiplying the number of observations in a single run minus 1 by the number of runs and then dividing by 2. In this example, (4 x 8)/2, or 16.
Using a 95-percent confidence, the risk is 5 percent, and dividing the risk by two we have 0.025. Looking up the critical F value for F16,16, 0.025 we obtain
2.33. If the calculated F value is greater than the critical F value, we reject the notion that the variances are equal. Because the calculated F value associated
with main effect is less than the critical F value, we conclude the effect is not statistically significant in reducing variation at the 95-percent confidence level.
A similar treatment for main effects B and C give F values of 19.74 and 1.050, respectively, showing that only the B factor is a significant contributor to variation reduction.
3. Natural logarithm of ratios of average variance. This method is based upon the fact that the natural log of the average variances ratio is normally
distributed. It was proposed by Douglas C. Montgomery as a method for examination of residuals from an experiment to assess the magnitude of the
dispersion effects. Montgomery determines the standard deviation of the residuals (difference in observed and expected experimental results) for the
factor setting "�" and for the factor setting "+." The resulting standard deviations are squared and then the ratio determined. Taking the natural log of
this ratio yields a normally distributed variable that can be treated as any normal z score. S.R. Schmidt and R.G. Launsby have also used this relationship to determine
whether effects are significant in variation reduction. The only difference is that they simply average all of the standard deviations from settings of "�" and then
square the result to report an average variance. This is repeated for the settings that are "+" and then the absolute value of the natural log is taken. This
approach is different in that Schmidt and Launsby average the standard deviations and then square the result to obtain the variance, whereas
Montgomery determines the variances first and then averages these variances. Using the Schmidt and Launsby approach for the main effect A, we obtain the
following test statistic:
We treat this test statistic as a z score. If the test statistic is greater than 1.96, we conclude that the factor is significant at the 95 percent level of confidence.
Because 0.37 isn't greater than 1.96, factor A isn't significant to variation reduction. Similar calculations for factors B and C give 3.00 and 0.36, respectively.
Again, factor B is found to be a major player in variation reduction. Taguchi uses signal-to-noise ratios, which essentially combine the location and
variation statistics into a single parameter much like a coefficient of variation. Schmidt and Jean-Pierre Boudot have conducted a simulation study that
addresses the effectiveness of these signal-to-noise ratios in the detection of variability effects and have concluded that they are completely ineffective in
identifying dispersion effects. They, along with Montgomery and Box, suggest that process location and variation statistics be dealt with independently. Variation reduction Focus initially on those process and design parameters that reduce variation. If
you find one, you've found a gold nugget. Lock down that factor and then proceed to find those factors that move the process or design mean. If you find
one of these, you've discovered a diamond. With all the gold and diamonds you can find, you can greatly increase the value of the process or design and
obtained knowledge about process and design parameters. References
1. Box, G.E.P., W.G. Hunter and J.S. Hunter. Statistics for Experimenters. New York: John Wiley and Sons, 1978. 2. Crossley, M.L.
The Desk Reference of Statistical Quality Methods. Milwaukee: ASQ Quality Press, 2000. 3. Montgomery, D.C. Design and Analysis of Experiments, Fourth Edition.
New York: John Wiley and Sons, 1997. 4. Schmidt, S.R. and R.G. Launsby. Understanding Industrial Designed Experiments,
Fourth Edition. Colorado Springs: Air Academy Press, 1998. 5. Schmidt, S.R. and J.R. Boudot. "A Monte Carlo Simulation Study
Comparing Effectiveness of Signal-to-Noise Ratios and Other Methods for Identifying Dispersion Effects." Rocky Mountain Quality Conference, 1989. About the author Mark L. Crossley is president of Quality Management Associates Inc. (www.qualman.com)
and is a CQE, CRE and CQA. He is the author of The Desk Reference of Statistical Quality Methods (ASQ Quality Press, 2000)
and is a regular instructor for American Society for Quality courses in introductory quality engineering and advanced topics in SPC. Crossley can be e-mailed at mcrossley@qualitydigest.com . |