Kurtosis and skewness aren't tropical diseases or pejorative descriptions of offbeat people. They represent key
indicators relating to data analysis. Hartford Simsack, quality manager for Greer Grate & Gate, has launched himself into the study of capability, but information about kurtosis and skewness
has apparently reached him in only fragmentary ways. Greer Grate & Gate has garnered a contract to manufacture windshield-washer buttons for a well-established company,
Padded Sell, which assembles dashboards for automotive manufacturers. The company, which requires windshield-washer buttons that will fit a shaft mechanism on each dashboard, has requested a
capability analysis for the part. Simsack begins the capability analysis by determining that the process is in control for this dimension. He seems to be on the right path for
the analysis, as a critical requirement for capability studies is identifying that the process is in control or stable. This is verified with a control chart. And by now, Simsack has had enough
experience with these charts that he creates a control chart whenever someone asks anything about a process, regardless of the question. 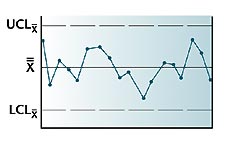
As he mulls over the significance of this finding and considers what to do next,
his immediate supervisor, W.T. "Red" Flagg, approaches his desk. Simsack immediately begins to explain the chart to Flagg, hoping to convince his boss of
his own understanding of statistics. Flagg notices that the skewness of the data is +1.2 and asks what that means.
"Oh, that's simply a guide for the analysis of the data," responds Simsack. "A high value here indicates that the process is all screwed up, and a low value
means everything is fine. Those values are overridden, however, by the fact that the control chart shows no points outside the control limits," he adds in an effort
to give the impression that he knows what he's talking about--something that's rarely true. Which of the following responses to his boss's inquiry would have been true?
Skewness is: a. A statistic that indicates the peakedness of the data b. A statistic that reflects a binomial distribution of the data c.
A guideline for the probability that the process is changing d. A statistic that gives information about the tails of the distribution e.
A term you would recognize only if you watch The Barbecue Channel
Answer d is correct. Kurtosis and skewness both apply to the shape of a data distribution. Any
distribution can be described by its central location (i.e., mean, median and mode), its variability (i.e., standard deviation and range) and its shape (i.e.,
kurtosis and skewness). Once again, Simsack missed the mark. It's simply never occurred to him that shape, except in specific applications, could be important.
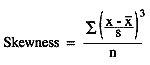
Skewness is the measure of a given distribution's asymmetry. Any normal distribution that is symmetrical has a skewness of 0.
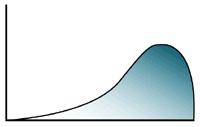
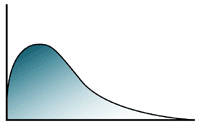
If the skewness is positive, this means that the tail of distribution goes out to the right; if it is negative, to the left. In general, the higher the absolute value of the
skewness statistic, the greater the tail is extended.
Positively Skewed
Negatively Skewed About the author
Michael J. Cleary, Ph.D., is professor emeritus, Wright State University, and founder of PQ Systems Inc. He has published articles on quality
management and statistical process control in a variety of academic and professional journals. E-mail Cleary at mcleary@qualitydigest.com . |