E2 in the ER
Michael J. Cleary, Ph.D.
mcleary@qualitydigest.com
Dr. Cal S. Terol, emergency
room administrator for St. Recover in the Long Run Hospital,
loves data. His favorite data displays are those that no
one can understand because their confusion gives him an
opportunity to demonstrate his own statistical erudition.
He loves the language of statistics even more than the clinical
jargon that surrounds him in the ER. After all, everyone
in the ER understands medical vocabulary, but statistics
remain an arcane mystery for which he’s the self-appointed
high priest.
Terol frequently points to displays of clinical data in
the ER administrative office, mumbling terminology no one
comprehends. “Oh, that chart demonstrates kurtosis
and skewness in the process,” he declares. Whenever
necessary, he obfuscates data’s meaning further by
mixing terminology that has little to do with analysis.
So, when he has an opportunity to attend a seminar about
control charts and their application in health care, he
leaps at the chance. The instructor introduces control limits
and teaches participants how to calculate them. Terol is
considering ways to confuse his colleagues with this formula
when the instructor introduces individual moving-range charts
and the role E2 plays in calculating control limits. “Bingo!”
he thinks.
Upon his return to the hospital, Terol holds forth to
whomever will listen, dropping X-bar and R chart terminology
and sprinkling E2 throughout his conversation. He’s
caught short, however, when one of the nurses asks him to
explain why he’d use E2 for an individual moving range
chart rather than A2, which is used for X-bar and R charts
in calculating control limits. His resourcefulness provides
an immediate response--one that leaves the nurse shaking
her head--but Terol himself doesn’t understand the
distinction between the two.
Which of the following is a correct statement about E2
and A2 with respect to creating an individual moving range
chart?
a) A2 is always the correct factor to use because it comes
alphabetically before E2, and one should use the first appropriate
factor.
b) E2 is the correct factor because it estimates 3 sigma
above and below the mean (X-bar).
c) For individual moving range charts, A2 and E2 will give
the same answer.
Answer b is the correct response.
In manufacturing, with its emphasis on mass production,
X-bar and R charts are the most common form of control charts.
Each sample is at least of the size of two, and five is
the most common. In these cases, upper and lower control
limits are calculated by these formulas:

A2 is a weighting factor that’s used to estimate
upper and lower control limits. They will be three standard
errors above the process average and three standard errors
below it.
Standard error = 
Applications of X-bar and R charts occur in health care,
but individual moving range charts are far more common (sample
size equals one).
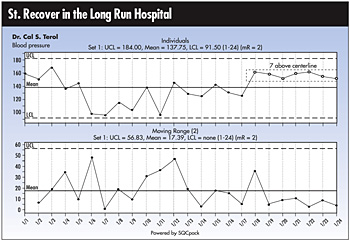
One might track a patient’s blood pressure, or any
other critical measure, on a daily basis. In charting this
data, a different weighting factor E2 is used.

where:
UCLX = upper control limit for the individuals
LCLX = lower control limit for the individuals
k = number of samples
E2 equals the weighting factor used to estimate three
standard deviations above and three below the process average.
Dr. Cal S. Terol might be a great health care administrator,
but when it comes to statistics, his number is up.
Michael J. Cleary, Ph.D., founder and president of
PQ Systems Inc., is a professor emeritus of management science
at Wright State University in Dayton, Ohio. Letters to the
editor regarding this column can be sent to letters@qualitydigest.com.
|