If the Shoe Fits
Pyncheon Shooz manages a team of inspectors for a manufacturer of extruded plastic products, primarily film cartridges for the photo industry. (He was formerly in leather products sales, but his name made it difficult to meet quotas.)
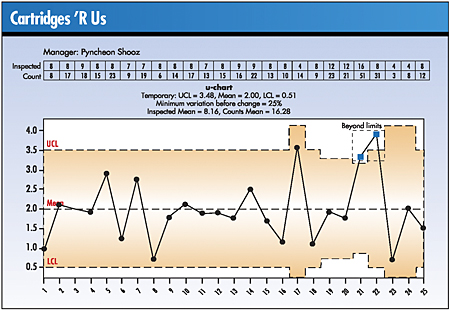
His company, Cartridges ‘R Us, has undergone a scheduled visit from its auditors as part of the firm’s ISO 9001 registration. The auditors found one major and two minor nonconformances. The major finding, unfortunately, focused on the paucity of statistical process control (SPC) knowledge among inspectors. Shooz is well aware of the deficiencies in this department. He has, after all, brought most of the inspectors from his former company, where there hadn’t been any ISO 9001 audits. Now he finds himself in the position of instructing the inspectors, or at least teaching them enough so that Cartridges ‘R Us will pass its next audit.
Because he can’t seem to get all the inspectors together at once, he begins with a group of five who are available for instruction--as long as Shooz promises to provide lunch. The other five inspectors have better offers.
Using print materials provided by the company’s SPC consultant, Shooz goes through the instruction carefully, page by page, introducing his inspectors to the meaning of attributes data. He’s always assumed that it didn’t make much difference which chart one used, as long as data were identified as either attributes or variables. Thus, when he turns the page and sees a section on u-charts, he begins to mumble. It occurs to him that, although he’s heard of these charts, he always thought they were called “you-charts,” to inspire ownership in process analysis.
To enlighten the waiting inspectors, Shooz finally points out that u-charts are really similar to X-bar and R charts, and control limits would be based on the normal distribution. He’s ready to move on quickly at that point. Was his quick-witted answer correct?
a) yes
b) no
Answer B is correct. U-charts are attributes charts, but that’s the only part that Pyncheon Shooz had right. The statistical basis for u-charts is related to Poisson, rather than normal, distribution. A u-chart is a control chart for a particular type of attributes datum. The role of any control chart is to monitor how a system changes over time. Attributes data plotted on a u-chart typically monitor the number of nonconformities produced. The number of errors on invoices, the number of scratches or blemishes found on a car window or the number of areas left incomplete on application forms could all be plotted on u-charts.
These types of attributes data have no maximum number of potential nonconformities. The data aren’t constrained by the sample size, unlike other types of attributes data. Unlike the c-chart, the u-chart can deal with varying sample sizes. A u-chart with a variable sample size is offered on page 20. You might note that when the sample size varies by more than 25 percent, the control limits are adjusted appropriately.
Michael J. Cleary, Ph.D., founder and president of PQ Systems Inc. is a noted authority in the field of quality management and a professor emeritus of management science at Wright State University in Dayton, Ohio. A 29-year professorship in management science has enabled Cleary to conduct extensive research and garner valuable experience in expanding quality management methods. He has published articles on quality management and statistical process control in a variety of academic and professional journals.
|