| by Bill Ritsch
Lean enterprise practices, more commonly known as lean manufacturing, have found their way into many quality management systems. Unfortunately, these methods have been relatively untested in other industries because the practice's evolution has been in manufacturing, and most literature on the subject is based on manufacturing examples.
The foundation of a lean system is continuous improvement through elimination of waste. Waste is defined as anything that doesn't add customer value. Waiting in lines, filling out excess paperwork or keying incorrect information into a database are wasteful, particularly in service-based industries. Because lean theory involves the elimination of waste, why wouldn't lean techniques apply in the service industry? They do, and the most common tool to begin a lean transformation is a value-stream map (VSM).
A VSM is a graphic tool for identifying nonvalue-added activities within a process. Typically, it's created in two phases: current state and future state. Unlike a flowchart, a VSM is meant to cause change. These changes are usually related to streamlining a process by removing queuing, movement, delay and other activities for which a customer is unwilling to pay. If change doesn't result from using a VSM, it hasn't succeeded.
After an organization has achieved the future-state map by removing nonvalue-added activities, the improved process can be flowcharted to communicate the new standard.
A VSM's purpose is to "see" a process from a different perspective. Traditionally, as in flowcharting, we tend to focus on activities that transform materials or information throughout the process. A flowchart's information is intended to graphically and qualitatively describe a process. Unfortunately, when we develop a flowchart we miss critical information that can guide us in making important decisions about improvement activities. We also tend to chart the process as we think it should operate, rather than as the process truly runs. A VSM describes how material and information actually move through your process.
It's best to develop the map through a focused team activity that can be referred to as a "VSM event." The event takes about two days to complete. Following this format allows the participants to focus on the task at hand and will ensure that the final result is achieved quickly. The two-day format comprises eight steps. Depending on the organization's level of experience and its exposure to continuous improvement, some of these steps might not be needed.
During an opening meeting between the management team and value-stream process owners, it's important to state the purpose of the VSM event--to map the value stream as it currently exists and works. The intent isn't to find scapegoats for inefficiencies in the process, but to gain an accurate understanding of how the process operates. This communication is intended to quiet any defensiveness on the part of process owners because the map will probe deeply into their work life and make visible most of the waste. Also at this time, the management team will want to tell employees who work within the value stream that the event is taking place. Again, the goal is to calm any defensive responses so that the most accurate information can be obtained.
It's important to train the VSM team for two purposes. First, the team should understand the concepts of lead time, waste, value-added activities and nonvalue-added activities as they pertain to lean methodologies. Second, the team must work from a standard set of definitions and icons when drawing the VSM. These can come from commonly used VSM tools or be customized to match the needs of the value stream under evaluation.
At this point, the team will assign two to four of its members to construct the current-state map. (The organization might choose to take the entire management team through the process, if schedules permit.)
Data can be collected through a number of different channels. However, it's extremely important that team members personally observe the process as it occurs and talk to employees who have tasks in the value stream. It's common for teams to pick a particular product of the value stream and follow it through the process if the lead time is less than the two days scheduled for the event. If time doesn't allow for this, teams will usually pick an item that's been completed in the value stream and retrace the steps it followed.
Data on each activity within the value stream should be collected and can include:
• Cycle times
• Changeover or setup times
• Number of people involved
• Quantity of units processed
• Quantity of changeovers for a given time period
• Downtime
• Batch sizes
The goal for data collection is to obtain as much information about the process as is possible in the time given. Even if some or all of the information is readily available in a database, the people within the value stream should be questioned to see if their perception of the activity matches what the data represent. Also, when data don't exist in a database, more than one person should be questioned about each activity to validate answers.
When each activity has been observed and the team feels good about the data it's collected, the current-state map can be constructed. Each activity should be labeled in a process box, and the data for that activity listed below it. Arrows should be used to show the flow of the product, and triangles between the process boxes can be used to depict inventory levels of work in process before each activity. Icons and arrows showing communication flows--whether they're electronic, manual, visible or something else--are drawn opposite the product flow, because they signal upstream activities that will react to downstream information. For an example of a typical current-state map, see figure 1.
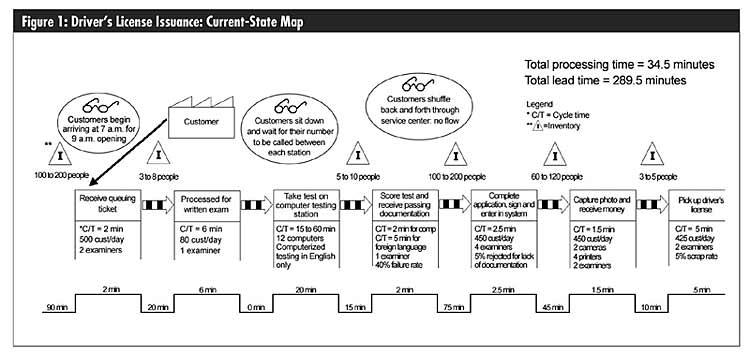
Finally, a sawtooth diagram should be drawn underneath the value stream to depict process and lead time. The diagram's upper teeth should be drawn under process boxes that depict activities in the value stream. The time to process a single unit of product should be written on each of these teeth. The lower gaps of the sawtooth diagram should be drawn between process boxes where inventory is represented in the value stream. This is where queue time is shown in the value stream and can be calculated using a days-of-inventory method or by other means where necessary.
Once the current-state map is drawn, the process time for the value stream can be calculated by adding the times along the upper teeth of the sawtooth diagram. The total lead time is calculated by adding all the times on the upper teeth and the lower gaps together. Often, the process time in the value stream will be less than five percent of the total lead time.
Once the current-state map is completed, managers and process owners should be called back to review the map and validate the information. The data on the map are open for questions, and a consensus must be reached before going any further. An 80-percent accuracy level is acceptable if the team struggles to come to a consensus on any data because prior to completing the map, no level of accuracy had existed at all. Once the team agrees that the current-state map is acceptable, the team can move on to step six.
Now that the team members have had a chance to see the value stream, they can begin to target improvement initiatives to eliminate and reduce bottlenecks and lead times. Brainstorming is the best method to create these initiatives. After completing some method of formal brainstorming, the team should use a logical approach to prioritizing the improvement initiatives. One of the most effective ways is to rank the improvement initiatives according to the organization's operating plan while considering potential costs. In the absence of an operating plan, teams can use an effect/cost approach to prioritize the improvement plan.
The future-state map can be drawn once improvement initiatives have been determined. Data in the future-state map are derived from targets that will evolve as a result of implementing the improvements. In most cases, the future-state map will look similar to the current-state map, with the addition of improved metrics. If activities in the current-state map can be eliminated or combined, this should be reflected in fewer process boxes in the future-state map.
The last step is to formalize the improvement initiatives strategy. This can take the shape of a matrix that outlines the area where the improvement will occur, describes the improvement, and states a quantifiable goal, owner and targeted completion date. An initial VSM can lead to many different improvement activities. When the strategy is developed, make sure not to overwhelm the team with too many improvements. Set a target that's achievable and measurable. Once the time frame to complete the activities has expired, a new current-state map can be drawn and compared to the former future-state map. If the team did a good job of planning, the new current-state map should resemble the former future-state map.
One common pitfall to avoid during a VSM event is developing improvement initiatives that focus on the process steps where products are being transformed. For example, in organizations that produce in high volumes, the team's tendency is to focus on cycle-time reduction. Traditional costing procedures swing prevailing attitudes toward more throughput in a given value stream. Academic training in engineering and business encourages us to focus on these types of activities and, as a result, we become very good at targeting and improving our value-added functions. As stated previously, it's common to discover that more than 95 percent of the time in a value stream is spent performing activities that don't add value. This is a part of the business we traditionally don't spend time on improving, yet it offers the most opportunity for improvement. The VSM's goal is to target these nonvalue-added activities for waste elimination or reduction.
When introducing a VSM, prepare to be challenged from all levels of the organization. The ideas that will be introduced counteract our traditional understanding of operations. Make sure that the proper level of training is done prior to and during the event to help employees see the process differently. Also, be sure to clearly explain the reasons for looking at the process in this new way. This communication should be given across the entire organization to counteract naysayers who oppose change. If the VSM event is executed properly and the improvement initiatives are successfully completed, the tide will begin to change, and naysayers eventually will become believers.
The VSM is a powerful tool that can help an organization learn how a process looks from its customers' perspective. The tool can be used to depict the activities within any business process, from shop floor activities to administrative tasks in the front office. Most important, the VSM will help people from different departments bridge gaps throughout the organization. They'll begin to understand the upstream and downstream activities and appreciate the importance of their roles in the overall process. Finally, employees will begin to think differently about the tasks they perform and develop their own improvement ideas. This is when continuous improvement becomes a way of life, and the organization becomes more responsive and adaptable to change.
Figures 1 and 2 depict current-state and future-state examples of how a VSM can be applied in a service industry. In this case, a common service that many of us dread--driver's license issuance--is developed using the flow of a customer needing to take a written test to receive a license. Embedded in this value stream are the basic services of renewal, replacement, and name and address changes.
Following the completion of VSM steps one through five, the team that developed the current-state map brainstormed the following improvement initiatives:
• Develop a creative staffing plan that allows for extended hours to eliminate a deluge at the beginning of the day.
• Develop written instructions in multiple languages detailing exactly the forms and documentation needed for each service a customer may need.
• Redesign the application forms for easier understanding and create a desk with template examples where customers can fill out their own paperwork.
• Create online practice exams in multiple languages.
• To decrease the failure rate, charge for a second test attempt.
• Provide computer-based testing in multiple languages, eliminating paper and pencil testing and manual scoring.
• Install one more camera at the photo station to keep up with demand.
• Develop a first-in, first-out line for photos and license receipt to prevent customers from sitting and returning to the process.
• Redesign the layout of service centers to eliminate confusion and create a continuous flow of customers.
• Create a one-stop help desk for customers who have unusual circumstances so they don't disrupt the flow.
These improvement initiatives are only a few of the ideas developed to improve the value stream for driver's license issuance. There are many small improvements that form during a VSM event that can also be implemented quickly.
Clearly, there are many more options to further improve the future-state map. This future state accomplished two goals of VSM and lean techniques. First, the improvement initiative strategy was created with a six-month time frame and the improvements that were called for were doable in this time period. Second, the team focused on improvements that were of little or no cost. This is a key learning point within lean systems: Avoid significant investment in capital until the process can't be improved without it.
Bill Ritsch is a project manager with Georgia Tech's Economic Development Institute. He specializes in lean transformations and has helped organizations apply lean principles in many production environments, including chemicals, assembly, job shop and food production. He recently worked with the state of Georgia to implement lean practices in driver's licensing services.
|