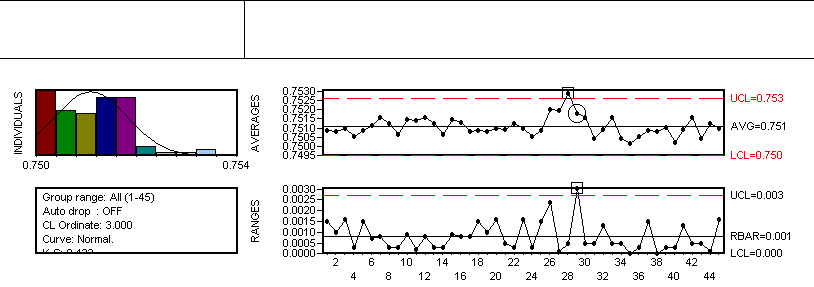
Here the range chart is almost out of control at point 12 and the X-bar chart is out of control at points 11 and 12--evidence that something is wrong with the process.
Because we're using subgroups of five, these points correspond to data points 55 through 60 in Table 1. An out-of-control control chart indicates that the process
has changed. Now we know that the points between 55 and 60 are significantly different that the points before and after. Our process study enters a new phase. We
have to find out why the process changed. One clue is the time at which it changed. Looking at Table 1, we see that point 55 was measured at about 12:30 p.m. We also see that point 52
was .7532. Out control chart tells us that the upper control limit for this process is .752. Point 52 didn't show up as an out-of-control point on the control chart because it was
averaged with other readings. But it is unusual. What could have changed? We head out to the production floor and ask the operator, Bill.
"Well," he says, "I did go to lunch at noon." "But why are there measurements between noon and one if you were at lunch?" "Oh," Bill
laughs. "We can't have the machines sitting idle just because I go to lunch. Charlie took over for me. He ran the lathe while I was at lunch." We have another clue:
We now know the process changed when the operator changed at noon. We track down Charlie. "Hey Charlie, I'm doing a study on lathe seven and I understand you were
operating it from noon to one yesterday." "That's right," Charlie says, suspiciously. "Why? Is there a problem?" "No, there's no problem really.
It's just that my control chart here shows that the process changed at noon and I'm trying to find out why. Did you make any adjustments?"
"No. I didn't adjust it. Bill said it had been running good. I just ran the parts." Our process study has entered still another phase. We not only know that
the process changed but we have persuaded two production operators that it changed. We know the change was not the result of operator adjustment. What could it be?
The production operators are an invaluable source of information on what might have made the process change. Two operators were making the same part number on the same machine,
but their parts are different. We now need to get the operators to demonstrate to you and to each other how they make the parts.
"Okay, Bill, please show us how you mount the part in the lathe." "Sure," Bill says with a smile. "I slide the collet back and I put the Teflon rod in like
this. Then I clamp it down and turn on the lathe." A slender white thread of Teflon spins into the air as the lathe cuts down the shaft.
"Is that the way you do it, Charlie?" "Yeah, I do it just like he showed ya," Charlie says. "Would you mind showing me?"
"Why? Bill just showed you." "Humor me, please?" "Look, I got better things to do. I don't know what you're doing with your charts and your
statistics. I need to get back to work." "I'll give you a dollar if you'll do it." Charlie laughs. "Okay, okay," he says. "I do it just like this.
Then Charlie opens the collet, puts in the part and turns the crank three times. "Whoa!" Bill cries. "What are you doing? That's way too much
pressure. If you clamp it down like that, you'll make the Teflon distort. It will no longer spin true. It can give you all kinds of crazy results. You have to use a light touch. Put
the part in and just use half a turn to hold it." "I've been running lathes all my life," Charlie says. "Yeah," Bill says. "But with steel. This
is Teflon. It's a plastic material. It's easy to distort. No wonder you were getting screwy readings on the OD." Using our process study, we've discovered why the
dimension changed during the day. The best part of this study is that it helps operators teach each other. Everyone works together as a team to make the process better. Do a little
investigating and add a dash of statistics, and you can solve any mystery. About the author Gregory P. Ferguson is quality manager of Parker Hannifin's Tucson, Arizona, facility. Comments can be e-mailed to him at gferguson@qualitydigest.com . |