by Gerald Lee
Every good quality practitioner knows the effect that poor quality has on top and bottom lines, and consequently that improving poor quality is a moneymaker. Although this is universally acknowledged, it’s not always clear how to go about improving poor quality. Poor quality is opportunity lost and the loss of precious resources, such as time and money, on unnecessary tasks and wasted materials. In this article I’ll discuss some of the obvious and less obvious opportunities lost due to poor quality. I’ll also discuss in greater detail an obscure and misunderstood cost that offers the turnaround opportunity of significant savings: the safety margin.
At ABB we use a metric known as cost of poor quality (COPQ). COPQ is measured by estimating the cost of all efforts undertaken in an organization, including materials and processes used in assembling our products, that don’t provide value to customers. In the lexicon of lean manufacturing, these are nonvalue-added activities. At ABB, COPQ is the sum of all nonvalue-added costs divided by the total revenue that’s generated. The resulting measurement is the percentage of revenue that’s lost due to waste.
COPQ is measured, reported, and tracked in each of the business units. COPQ is used to measure progress within the organization and to identify best practices that can be shared throughout the company. COPQ is a metric and a learning tool, helping an organization to understand what’s nonvalue-added and to establish opportunities for improvement.
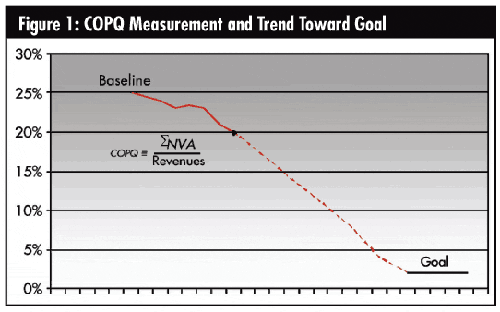
Measuring COPQ establishes a baseline, and eventually a trend line (heading, hopefully, toward the goal), as seen in figure 1, below.
The value of COPQ Inspection, waste, rework, and warranty costs are the most obvious nonvalue-added activities that go into the COPQ metric. It’s estimated that up to 10 percent of revenue is wasted on these activities, which are fairly easy to measure and are understood by most people, even those not practicing in the quality field. In a typical organization, a great deal of effort is spent in improving these metrics. It’s easy to gain support and encouragement to eliminate these wastes.
However, as seen in figure 2, below, inspection, waste, rework, and warranty costs are only the tip of an iceberg composed of many unknown and misunderstood nonvalue-adding activities. The nonvalue-adding costs from waste, inspection, warranty, and rework are dwarfed by the root causes lurking unseen beneath the waterline.
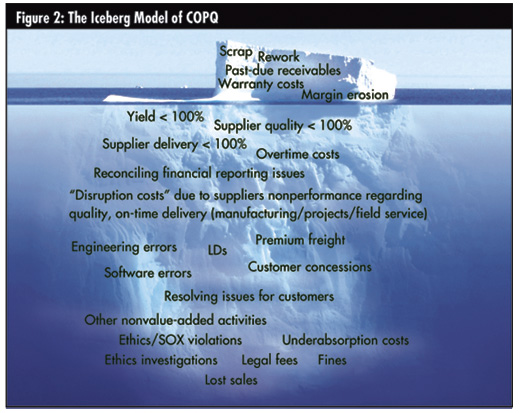
Most alert organizations realize that losses can accrue from wastes such as excess inventories, unnecessary motion, and supplier nonconformance. The enlightened company will also see that losses can occur from more obscure wastes, such as unnecessary paperwork, large lot sizes, and excessive auditing. These wastes lead to additional estimated COPQ losses of up to 15 percent of revenue.
In a typical facility, there’s normally much less effort spent on improving (and profiting from) these more esoteric nonvalue-added activities. That’s because, in part, they’re difficult to characterize or can only be quantified with “soft” numbers. So it’s difficult to gain support for their elimination. But make no mistake: These are real opportunities and often the root causes of wastes.
Another waste is easy to understand and quantify, but even in the most enlightened organizations receives little attention because there’s no obvious indication that anything is wrong. In most instances quality appears to be excellent, and no action seems to be required. To make matters worse, this hidden problem can continue to grow while quality appears to improve. This insidious waste is the safety margin.
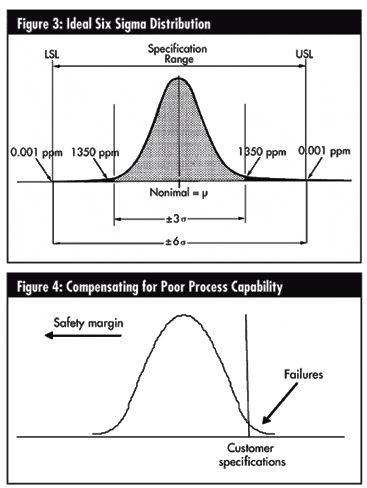
Consider the Six Sigma distribution shown in figure 3, at right. This simple and eloquent chart shows the interaction between product specifications and process capability--the beauty of a Six Sigma design.
A two-sided Six Sigma design can be difficult and expensive both to achieve and sustain. Most designs are single-sided. A specification will call for a hole smaller than, a weight larger than, or a temperature lower than a nominal value. Although a single-sided design specification at first glance might appear helpful, it can mask serious flaws.
Consider the situation shown in figure 4, at right. Here the specification calls for the process to be capable of delivering a measure less than a nominal value, but the process capability is poor and widely distributed, so failures sometimes occur. In this situation it’s easy for the engineer to add a safety margin to prevent failures. If this “fixes” the problem and failures no longer occur, it appears that waste is no longer being generated.
In fact, waste can actually be increasing and going unnoticed because it’s hidden to most observers in most industries.
An example of this phenomenon and its consequences can be seen in the food-processing industry. There, a product must meet the weight specification printed on the packaging or there will be serious consequences from both governmental regulators and consumer groups. A margin of safety can be added to each package to make certain that this never happens, but an extra ounce or gram added to each package represents waste and, subsequently, profit loss. It’s essential in this highly competitive industry that processes be capable, or product costs will soar.
In most other industries the safety margin appears innocuous and is considered a lifesaver to the designer. It’s easier to add a little to the design so that the requirement is always met than it is to ensure that the process is exact. What’s a little additional material when it decreases failures and improves product quality? In many cases this seems like a prudent alternative, but this is a dangerous protocol.
The most obvious reason is the cost of the extra material. Not as obvious are the indirect costs for handling, shipping, and finishing the material. These can be quite high and won’t be directly attributable to the safety margin. Adding a margin of safety also means that the process can be sloppy or out of control. The process might be used on multiple products, or it could set precedence for all processes. Finally, a process that’s out of control will tend over time to become even more out of control. So even if a safety margin is used, the process eventually will produce product that’s out of specification. What happens next? An operation that doesn’t control its processes usually will add more safety margin, and the cycle repeats.
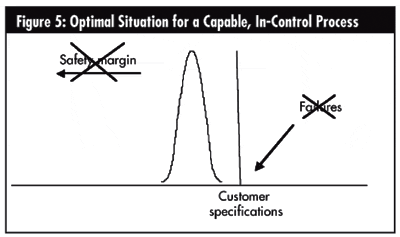 Figure 5, at right, shows an optimal situation where processes are capable, well understood, and in control. In this instance safety margins aren’t necessary, and failures don’t occur. In an organization where this methodology is followed, costs can be contained, designs can be optimized, and a competitive advantage can be maintained. Figure 5, at right, shows an optimal situation where processes are capable, well understood, and in control. In this instance safety margins aren’t necessary, and failures don’t occur. In an organization where this methodology is followed, costs can be contained, designs can be optimized, and a competitive advantage can be maintained.
How often does this occur? It varies depending on the industry and the age of the product. No capable engineer will ever design large safety margins into a new product or process. Nonetheless, it makes sense to verify this. One method to confirm that minimal safety margins are used in a design is to add this verification to the design reviews or the phases-and-gates checklist.
Even if safety margins are minimized during design, this is an insidious problem that will crop up repeatedly. This is especially true of any products that require customization. Customization leads to multiple engineering opportunities, and, let’s face it, engineers are paid to engineer. A good engineer will try to improve a product, given the opportunity, but he or she doesn’t always understand the justification for the original design. Insistence on using product standards can help prevent this.
A more typical scenario is when problems occur in the process and it’s considered easier to overbuild the product instead of correcting the process. Materials are made a little thicker, or a better grade is used; external features, such as cooling fans, are added; or extra process steps are taken so that the product can pass the final test. This is considered a prudent and cost-effective solution, when in fact it’s like placing a band-aid on a festering sore. Adhering to sound design practices and process monitoring can help minimize this problem.
How do you identify the problem? One of the easiest ways is to compare your products to your competitors’, to a similar product from another facility, or to a product from a world-class manufacturer that has many of the same characteristics.
From the product perspective, compare the weight, size, number of components, fit and finish, and cost. If your product is heavier, larger, or more complex than your comparison model, this is an opportunity to simplify.
From the process perspective, compare labor hours, throughput time, the number of process steps, the complexity of the process, and the product yields. Look into the time it takes to deliver your product, the amount of packaging required, or if special handling is needed. Look for anything out of the ordinary. If your order-to-delivery time is longer than your competitors’, there’s probably an opportunity being lost.
How much can be saved? Consider how much bigger, heavier, or more complex your product is due to the safety margins. Consider how much more expensive a heavier and larger product is to ship, how much more handling is required, and if any other special processing is necessary. I’ve seen instances where a product was 40-percent heavier than a similar product.
As a general rule, one should use the Taguchi loss function to answer this question. You’ll see an exponential increase in costs the further you are from specification. At first glance, this seems overly harsh, but consider all the possible added costs (e.g., 40 percent more materials, 40 percent more handling, 40 percent more shipping and preparation, and 40 percent more processing). If the product falls outside the specification limit, the loss should theoretically be 100 percent. This is indeed a very slippery slope, where at first glance it would appear as if no problem exists whatsoever.
Although it’s difficult to say how much can be saved on any individual effort, all these factors should be considered when determining how much of an opportunity exists.
Poor quality is opportunity lost. Understanding where and why these opportunities exist is a chance to improve the bottom line. Although there’s good value to be gained by improving scrap, rework, and warranty costs, there’s even greater value in looking for the root causes of these, because the return is normally much greater.
Waste due to safety margins can be easily prevented if good design practices are followed and product standards are used. Waste due to safety margins can also be easily discovered with a little knowledge and effort. Once discovered, this can be the source of huge opportunity and a clear competitive advantage.
Gerald Lee is the director of internal audit, manufacturing operations review with ABB in Raleigh, North Carolina. He works with ABB facilities worldwide to improve operational excellence. Prior to ABB, Lee worked at Eastman Kodak in Rochester, New York.
|

 The hidden cost of safety margins