Jagged Control Limits
Michael J. Cleary, Ph.D.
mcleary@qualitydigest.com
Hartford Simsack, longing for
the Black Belt status inspired by his son's tae kwon do
classes, believes that if he can pull off a project that
will save Greer Grate & Gate money--preferably lots
of money--his boss, Rock DeBote, will consider advancing
him to the position of production manager. Simsack begins
by trying to think of big-money projects and settles on
investigating defects that are often found in railing connectors.
This problem has plagued the company for years, and each
defect costs $1.12 to rework. Simsack figures that at the
current rate of railing production, the defect costs the
company $6.2 million per year.
If he could get the defect rate down by even a half of
one percent, he could save the company $1.2 million. "Now
that's worth doing," he tells himself.
Things are looking up for Simsack, although the problem
of jagged control limits that we considered in last month's
column continues to plague him--and worry his boss.
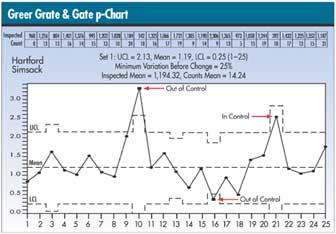
DeBote notes that sample 21 would be out of control if
the limits hadn't been adjusted, and sample 16 would be
considered in control if Simsack hadn't manipulated the
control limits. "You can't just move control limits
around like pieces of furniture," he tells Simsack.
"You've made them fit the outcome you wanted, rather
than letting them be set by the data."
Simsack, of course, is speechless--or almost speechless--after
his boss's outburst. "This p-chart is based on the
binomial theorem," he stammers, remembering that this
explanation had worked before. But this time his boss isn't
satisfied. "Control limits don't just go up and down
on their own like a yo-yo!" he exclaims. Remembering
his wife's expression about life's exigencies, Simsack blurts
out, "They do if the average is made of ups and downs."
Could it be that Simsack is right in his assessment?
Alas, Simsack has once again struck out.
He's correct about the binomial theorem as the basis for
the p-chart. But why do control limits become wider when
a sample size is small and tighter when the sample size
is large? I've illustrated this in the classroom by selecting
two students, whom we'll call Arvid and Noah. Arvid is invited
to select 20 students randomly and ask them whether they
believe the economy is improving. Then Noah does the same,
this time with 200 students.
If Arvid asks 20 students and Noah asks 200 students,
who would be more accurate? Of course, the more accurate
would be Noah because he has more data. This would relate
to tighter control limits on a control chart and would mean
wider control limits for Arvid. When I ask students which
of the two would be more accurate, they respond Noah because
he has a much larger sample size than Arvid.
To demonstrate this mathematically, consult the formula
for control limits:
If n becomes larger, the control limits become tighter.
When n becomes smaller, the opposite is true.
In the example, n-bar , the average sample size, is 1,194.
Sample 16 is 2,306, which is more than 25 percent of n¯
, and sample 21 is 392, which is less than 25 percent of
n-bar . The readjustment in control limits can be seen on
the chart above.
A large sample size renders greater confidence in the
sample results; therefore, control limits would be tighter.
A sample size of less than 25 percent of the average sample
size would generate less confidence in the sample results.
Michael J. Cleary, Ph.D., is a professor emeritus at Wright
State University and founder of PQ Systems Inc. Letters
to the editor regarding this column can be e-mailed to letters@qualitydigest.com.
|