by Bill Farrell, Ph.D., and Tom Simas
To understand Six Sigma, you must first realize that every process has variation--including the process your body uses to control internal temperature, the process a medical facility uses to admit patients or the process health care providers use to administer angiotensin-converting enzyme (ACE) inhibitors to congestive heart failure (CHF) patients as they are discharged from the hospital. All of these processes have a goal or desired output, and they all vary in how well they meet that goal. The statistical term "sigma" represents how consistently a process is meeting its goal, which is expressed as a specific requirement. The formal statistical definitions of sigma describe in technical terms how well a process produces results that fall within the range of these specified requirements.
One of the most important aspects of Six Sigma is its absolute demand for measurable results. Organizations have a limited amount of time, money and resources. When a project team gets started, its members will use a very specific process to guide them. This sequence of steps is called DMAIC, which stands for each of the major steps in a Six Sigma project: define, measure, analyze, improve and control. This article will use these steps to frame a case study in which Sutter Health, one of the nation's leading nonprofit health care providers, sought to improve the quality of care for people with CHF.
Serving more than 100 communities in Northern California, Sutter Health is a family of nonprofit hospitals and physician organizations that share resources and expertise to advance health care quality. For the past six to eight years, Sutter Health has worked on roughly one new clinical initiative per year. Currently, Sutter Health tracks progress on the following initiatives:
• Breast cancer
• First pregnancy and delivery
• Childhood asthma
• Acute myocardial infarction
• Pressure ulcers
• Community-acquired pneumonia
• CHF
This work had its inception in 1998, when Gordon Hunt Jr., M.D., senior vice president and chief medical officer of Sutter Health, brought in one of the present authors (Bill Farrell) to provide statistical rigor to the quality improvement process. Dr. Hunt had just completed the Advanced Training Program at Intermountain Health Care and was anxious to apply techniques such as statistical process control to quantify the improvements he was seeing in the treatment of breast cancer.
Sutter Health's commitment to this paradigm can be seen in the Management and Clinical Excellence Program, an internal mini-version of Intermountain Health Care's Advanced Training Program. To date, more than 450 Sutter Health employees have been trained in Six Sigma and rapid cycle-improvement techniques
by a faculty comprising both internal and nationally renowned external
experts (including Brent James, M.D., M.Stat., the originator of the Intermountain Health Care Advanced Training Program).
Using the Six Sigma DMAIC process, let's look at how Sutter Health approached CHF.
CHF was chosen early on as one of Sutter Health's clinical initiatives, both because of the increasing burden the disease places on health care organizations and because of wide variations seen in the treatment of the disease. It's primarily a disease of the elderly, and as life spans increase, more people are being diagnosed with CHF. At the onset of the initiative, Sutter decided to focus on ACE inhibitors as the treatment of choice for CHF. Several random clinical trials had demonstrated the efficacy of this class of drugs in treating the disease, and other studies had shown wide variability in the extent to which CHF patients received these drugs. (Sutter is currently tracking nine measures for the inpatient CHF initiative but is focusing on ACE at discharge for this case study.)
Sutter collects data quarterly for the initiative. Data collection initially was cumbersome, relying on manual chart review at each of the 20 Sutter Health hospitals that treat CHF patients. The process has been streamlined over time, with the data now available in a data warehouse.
Sutter uses bar charts and spider (or radar) charts to compare hospitals for the current quarter's results. Statistical process control methodology (at the heart of Six Sigma) is used to track performance for individual affiliates over time, and confidence interval (CI) methodology is used to compare performance to a target.
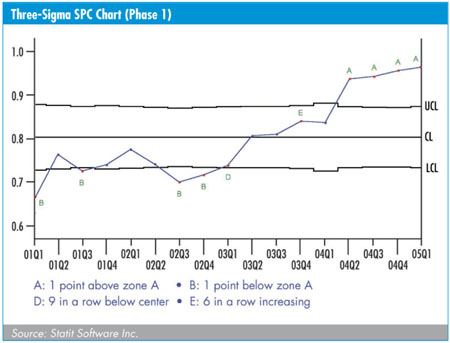
The figure above shows a standard three-sigma SPC chart for the fictitious Sutter St. Elsewhere Hospital, revealing the performance over time in getting ACE inhibitors to CHF patients as they are discharged from the hospital. Although the data are fictitious, they reflect real progress at Sutter Health in getting this important medication to people who have been hospitalized with CHF.
Because numerator and denominator data are available for this measure, a p-chart is used. Statistical process control software plots the individual data points, draws the center line as the average of the data points and draws the three-sigma control lines. The width of the control lines varies from quarter to quarter because the sigma measure depends (in part) on sample size, which in this case varies over time. Most important, the SPC software looks for and labels "rule violations," that is, cases where a particular data point shows unusual variability given the history of the process. In the figure, the last four data points are labeled "A," meaning that they are beyond three sigma on the high side. Several earlier data points are labeled "B," meaning that they are beyond three sigma on the low side.
This figure shows significant improvement. Seeing this, one might ask, "How much improvement is enough?" All of Sutter Health's clinical initiative measures have targets attached to them, so one answer to this question could be, "When everyone is at target." Statistical process control by itself cannot provide the answer, so Sutter turned to another technique, developed by Dr. James, which involves "tricking" SPC software into drawing a pseudo-confidence interval chart.
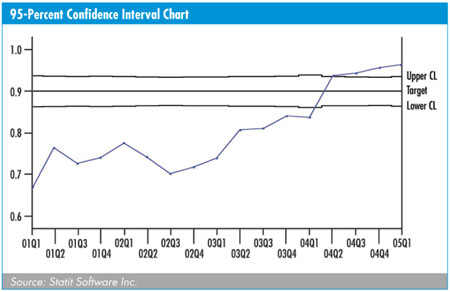
To implement this technique, Sutter fixes the center line at the target (i.e., 90 percent in the case of ACE inhibitors at discharge), rather than letting the software calculate the center line. In addition, the software draws two-sigma limits, rather than the standard three-sigma limits. Finally, the rule violation labels are turned off because they have no meaning in this context. The result, as shown in the figure above, is an unusual-looking but useful 95-percent confidence interval chart (three-sigma limits would produce a 99-percent CI chart).
Interpreting the data is simple: If a data point lies outside the 95-percent "envelope," it is significantly different from (i.e., higher or lower than) the target. Points inside the envelope do not differ, in a statistical sense, from the target.
In the present (fictitious) case, we see that although Sutter St. Elsewhere made significant positive progress from an SPC perspective, it took the hospital more than three years to move its ACE performance into (and beyond) the target zone.
Using these two methodologies in tandem provides a more complete picture of Sutter Health's improvement in getting ACE inhibitors to CHF patients. An affiliate may show no significant triggers on its SPC chart but have 18 consecutive quarters where its performance is significantly favorable to the target. Similarly, another affiliate may not reach the target zone but demonstrates several instances of significant upticks on the SPC chart; these are recognized and rewarded.
In an industrial Six Sigma effort, control could mean keeping a process within a tight set of specification limits. This is less relevant in a health care setting--at least in the early stages of clinical improvement--where, in most instances, we want to see a process demonstrate significant upward movement. In other words, we want our processes to be out of control. However, as time goes on and clinical improvement processes start to mature, we hope to be in a position to utilize another tool in the SPC arsenal: the phase chart. This chart splits a process into "before" and "after" phases. It's commonly used in industry when a major change occurs--when a robot car painter replaces a human one, for example. Changes in health care delivery are not usually that abrupt, but the goal is to have most processes working at a relatively high level with relatively low variability.
For illustrative purposes, we will suggest that the ACE inhibitor process at Sutter St. Elsewhere moved to a steady-state phase 2 between the first and second quarters of 2004. The figure below presents the appropriate SPC chart for this process.
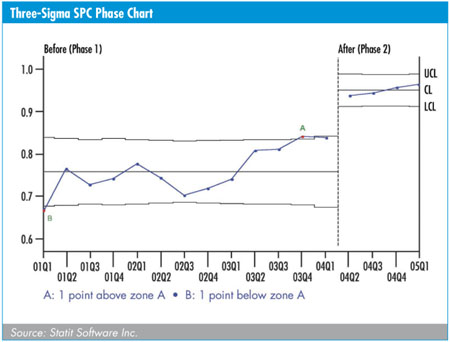
The phase chart shows a process with significant improvement over 12 quarters, followed by four quarters where the process is in control at a new, higher level.
At the moment, it is rare that a health- care delivery process shows this kind of abrupt shift and steady-state maturity. Sutter Health is committed to using Six Sigma tools for the long term, however, and looks forward to getting all of its quality processes in good control.
In summary, think of Six Sigma as a structured way for your organization to solve important problems. Six Sigma teams use the DMAIC method to diagnose and resolve these problems. Software tools are critically important to the success of your Six Sigma efforts. In the analyze phase, Sutter Health emphasized the understanding of the baseline. Before we move forward, we must know where we have been. To analyze is to quantify. With this tool, we can measure our interventions or new results against the baseline. If an intervention is needed, we do so in the hope that our processes will be improved. But what constitutes "improvement?" Trend charts can help us understand the level of improvement from one cycle to the next.
In this article, we proposed a unique and interesting way of measuring improvement through the use of a confidence interval chart. With our emphasis on continued process improvement, we need to ensure the control component. A phase chart will not only display pre- and post-intervention analyses, including a computed center line, control limits, etc. for each phase, but also can continue to provide feedback relative to the new process to ensure that it is working at a relatively high level with relatively low variability over time.
Bill Farrell, Ph.D., is senior analyst for Sutter Health. Farrell applies statistical rigor to a wide variety of clinical data to more reliably underpin quality improvement efforts. He utilizes Six Sigma techniques such as statistical process control to ensure that an observed change in an outcome is real and not random. He has taught research methodology and statistical analysis at the University of California at Berkeley and the University of San Francisco. He received his doctorate in psychology from Stanford University.
Tom Simas has a master's degree in education from Oregon State University. He has been president and CEO of Statit Software Inc. ( www.statit.com) and its predecessor, Statware, for more than 10 years. During this time, Simas' focus has been to help manufacturers and health care providers realize the benefits of statistical process control techniques to improve processes and their outcomes. Simas is a regular speaker and contributor at various quality improvement conferences. QD
|