Simsack’s Fishy Response
To everyone’s surprise
but Hartford Simsack’s, he’s been invited to
be a guest lecturer at his local community college. He was
recommended for the position by his mentor, Professor Stan
Deviation. Although he’s nearly given up on Simsack
becoming a competent statistician, Deviation hopes that
his student will master the subject if he, in turn, has
an opportunity to teach it.
Simsack, who fails in his attempts to secure the title
“professor” for his new venture, nonetheless
forges ahead with plans for his first lesson. Of course
he must take several days off from his position at Greer
Grate & Gate because class preparation is so demanding.
He decides that he’ll begin with basic data analysis
to warm up his students and let them experience his own
wisdom firsthand.
“Three ways of looking at data are through the concepts
of central location, shape and variability,” Simsack
drones. He notices that several students seem intent on
his lecture, recording every word on their PDAs. Occasionally,
their serious concentration is punctuated by beeps and trills,
but Simsack assumes that the noises are generated by overloading
their systems with formulas.
Emboldened, Simsack moves next to the concept of control
charts, leading the class through an exercise on creating
X-bar and R charts. A student raises her hand to ask a question--always
a dangerous moment for Simsack, who only skates on the surface
of understanding these concepts himself. She asks about
Ishikawa diagrams, which are used by colleagues at her part-time
job with a local hospital.
Because Simsack has never heard of Ishikawa diagrams,
he has no idea what she’s talking about. Never at
a loss, however, he recovers his composure by defining the
Taguchi loss function instead. That’s the only statistical
concept he knows with a Japanese name, and he assumes they
must be related.
“That’s a complex statistical methodology
used to measure costs when you’re off target,”
he tells the student confidently. (Simsack is known for
his confident attitude.)
Is Simsack himself off-target? Or did he happen to score
a bull’s-eye accidentally with his definition?
a) Amazingly, he’s managed to identify the Ishikawa
diagram without ever seeing one.
b) Sorry, Simsack. The only thing Taguchi and Ishikawa
have in common is that they’re both named after Japanese
statisticians.
The correct answer is b. Simsack is wrong again.
Taguchi is known for his work on the loss function that
first gained recognition during the 1980s. The Ishikawa
diagram is more commonly referred to as a “fishbone”
or cause-and-effect diagram. It was developed in 1943 by
Professor Kaoru Ishikawa, president of the Musachi Institute
of Technology in Tokyo.
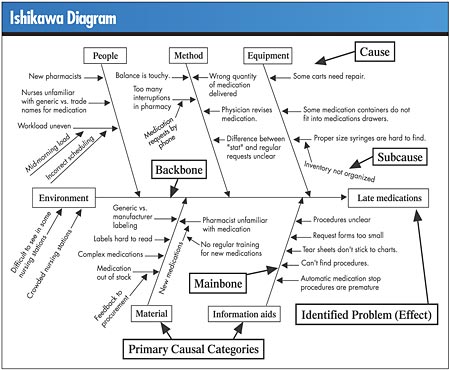
The Ishikawa diagram is an excellent tool to apply to
problem solving. For example, in the chart above, the problem
for a hospital pharmacy is identified as “late medications.”
Brainstorming has elicited possible causes for this problem,
recorded on appropriate “bones” or categories.
The next step involves looking for the most likely cause(s),
and then collecting data about the current situation with
respect to that cause.
Simsack might consider an Ishikawa diagram as he analyzes
problems associated with his lecturing.
Michael J. Cleary, Ph.D., founder and president of
PQ Systems Inc. is a noted authority in the field of quality
management and a professor emeritus of management science
at Wright State University in Dayton, Ohio. A 29-year professorship
in management science has enabled him to conduct extensive
research and garner valuable experience in expanding quality
management methods. He has published articles on quality
management and statistical process control in a variety
of academic and professional journals.
|