Two More Basic Lessons
I want to revisit the data from my September 2006 column ("A Handy Technique," online at www.qualitydigest.com/sept06/departments/spc_guide.shtml ) to review one learning point and show a special case. I'd also like to demonstrate a simple technique that can quickly find outliers, if the statistical aspects of such practices give you sweaty palms.
Some of you no doubt noticed that the overall p = 0.05 and p = 0.01 limits of my summed rank scores analysis were approximately 3.1 and 3.5 standard deviations, respectively. You might be wondering how in the world I obtained them.
Generally, given the structure of many data sets, one doesn't have the luxury of calculating exact limits. Because it's possible here, I'll demonstrate the calculation and address an additional important point.
To review the scenario, 10 sets of rankings for each of 21 counties were summed. However, because of the nature of rankings, you don't have 21 independent observations. Once 20 sums are "known," the 21st is also known by default. The overall average is always 110 (10 × 11) and isn't affected by the individual values. So there are two issues: Statistically, one is making, in essence, only 20 comparisons; implicitly deleting an observation to "test" it vis-à-vis the average of the remaining observations isn't possible. (This means that "adjusting" the limits via the SQRT((n-1)/n) factor is unnecessary.)
Because we're making 20 simultaneous decisions, what's the probability needed to ensure that, if there are no outliers, there's an overall risk of 0.05 or 0.01 of creating a false signal? In the current case, if you naively use p = 0.05, the probability of at least one data point being a special cause when it isn't is [1-(0.95)20] = 0.642.
So what level of p makes [1-p20] = 0.05 (and 0.01)? The answer is 0.997439 (and 0.999498), respectively. Further, because these are two-sided tests, I need to "redistribute" the probability so that half is on each side of the limits, meaning that I need to find the t-values for 0.998719 (and 0.999749), with [(k-1) × (T-1)] degrees of freedom (in this case, 9 × 20 = 180). These t-values are 3.06 (and 3.54).
Thus, as espoused in my February 2006 column, "Why Three Standard Deviations?" ( www.qualitydigest.com/feb06/department/spc_guide.shtml), and all this statistical mumbo jumbo aside, using "3" is pretty good, eh?
A five-number summary can be constructed from the table in figure 1, where the minimum is 42, the first quartile (Q1) is 95.5, the median is 107, the third quartile (Q3) is 124 and the maximum is 181.
A box-and-whisker plot (as seen in figure 2) is a distribution-free graphic that takes the five-number summary one step further to calculate a criterion to detect potential outliers.
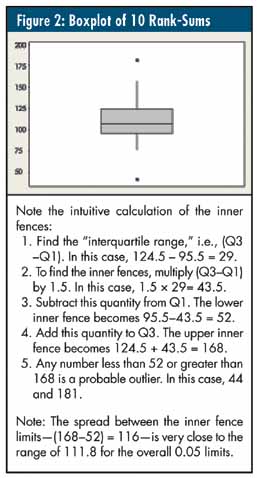 The first and third quartiles form a "box" containing the middle 50 percent of the data. With the median notated within the box, lines are drawn from the sides of the box to the last actual data values within the inner fence (described below), i.e., the "whiskers." Actual data values outside of this fence are plotted with an asterisk. The first and third quartiles form a "box" containing the middle 50 percent of the data. With the median notated within the box, lines are drawn from the sides of the box to the last actual data values within the inner fence (described below), i.e., the "whiskers." Actual data values outside of this fence are plotted with an asterisk.
Note: The standard deviation of all 21 scores is 29.2, which, to correspond to the inner fences, encompasses approximately ±2 standard deviations around the mean. Of course, this is a moot point because the presence of special causes invalidates this (typical) calculation--and once again demonstrates that three standard deviations, calculated correctly, is a very good criterion for declaring outliers.
Davis Balestracci is a member of the American Society for Quality and past chair of its statistics division. Visit his Web site at www.dbharmony.com.
|
