What np Charts Can Tell You
Michael J. Cleary, Ph.D.
mcleary@qualitydigest.com
Hy Sedrate, director of quality
for St. Recover in the Longrun Hospital, has been worried
about his organization's future and, more specifically,
about his own. Through a series of complex arrangements,
St. Recover has been acquired by Santa Cura Hospitals, a
large regional organization made up of some two dozen hospitals
and clinics.
Sedrate has learned to manage quality systems at St. Recover--but
only through the prowess of his SPC team, which works nonstop
analyzing hospital data.
Sedrate knows that he won't be promoted to the larger
organization without a dramatic demonstration of quality
improvement in his organization. The alternative is grim
because there are apparently plenty of other quality directors
in the same position within the Santa Cura system.
After walking around the hospital and considering the
possibilities, Sedrate determines that a highly visible
project he's capable of supervising concerns the number
of medications that are either incomplete or inaccurate
when they're delivered from the pharmacy.
"Prescription drugs are always in the news,"
he muses, "so everyone will notice our improvement."
With that confidence, he arranges for the pharmacists
to gather data relating to missed medications. Sedrate knows
he'll have plenty to work with because the pharmacy has
been collecting data for the Joint Commission on Health
Care Accreditation. He decides that the data should be considered
as attributes data because he'll be measuring nonconforming
items, defined as those medications that fail to be delivered
on time. Further, he believes that an np chart is the appropriate
way to analyze the data because, in effect, he'll be examining
the number of deliveries with mistakes.
He develops the chart below, based on the data provided
by the pharmacists.
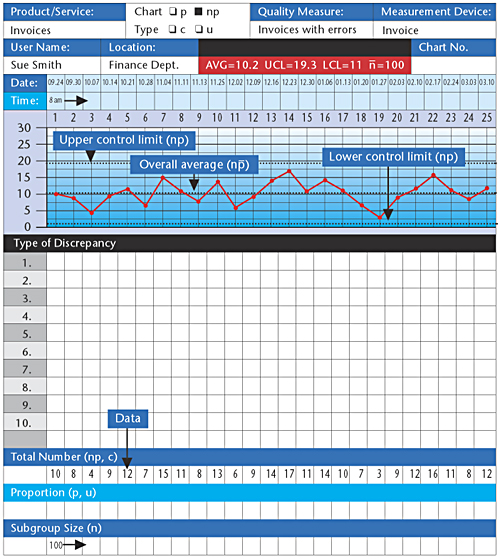
However, when Sedrate analyzes the chart, he's disappointed
that the system seems to be in control. "I was hoping
to see lots of out-of-control points so we could eliminate
special causes," he mutters to himself, deciding that
the np chart gives him nothing dramatic with which to enhance
his portfolio in the hospital. He's so worried that he finds
himself losing sleep at night. Is his anxiety merited?
Sedrate's high blood pressure is pointless because the
pharmacy process gives him plenty of opportunities to improve
quality. The point is not just to identify out-of-control
conditions but to improve the process. The np chart reflects
that the process is now generating an average of 10.2 nonconformities
per week.
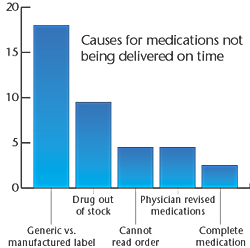
By brainstorming and using cause-and-effect analysis,
Pareto diagrams and other problem-solving and data-analysis
tools, Sedrate's improvement team can identify ways to further
reduce the number of missed prescriptions.
Quality improvement isn't simply gathering data but analyzing
data and organizing it in order to determineways to improve
a process. The plan-do-study-act cycle focuses on continuously
examining processes in order to bring them to even greater
levels of predictability.
Michael J. Cleary, Ph.D., is a professor emeritus at Wright
State University and founder of PQ Systems Inc. He has published
articles on quality management and statistical process control
in a variety of academic and professional journals. His
Web site is www.pqsystems.com.
Letters to the editor regarding this column can be e-mailed
to letters@qualitydigest.com.
|