Beyond Deviation
Dr. Noah Tahl learned about using control charts,
standard deviation and histograms in a two-hour workshop
he attended during a national health care conference. He’s
seen for himself how these concepts help hospitals and other
health care institutions organize and analyze their data,
and he’s determined to use statistical process control
to improve quality measures at St. Maybe Hospital. In this
effort, he trains his staff to ensure that all department
personnel understand the basics of statistics and can use
them accordingly.
He’s determined to keep at least a page ahead of
the group he’s training. So while everyone else is
on the same page, Tahl stays up late to assure himself that
he knows more than his trainees. It’s a never-ending
struggle to stay ahead.
After he’s demonstrated the formula for calculating
standard deviation and shown his trainees how control charts
and histograms will help them understand processes, he introduces
a software program that creates charts from data in established
spreadsheets such as Excel. “This will make your life
easier,” he promises, but as it turns out, it could
very well make his own harder.
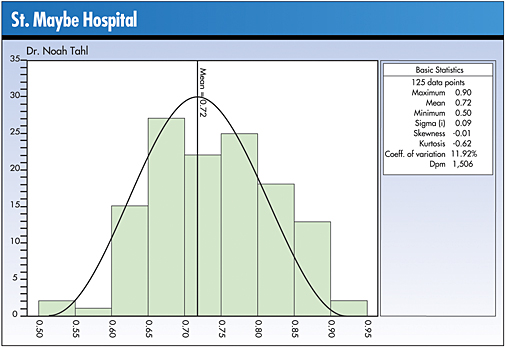
Alec Smart, one of his department managers, comes across
the concept of the coefficient of variation as he explores
the printout of his charted data. “What does it mean
when the coefficient of variation is 11.92?” he asks.
Although the chapter on coefficient of variation isn’t
one that Tahl has studied yet, he feels compelled to respond,
especially because the entire class is looking expectantly
at him. “That’s really the sum of the log of
the standard deviation,” he mumbles. Although no one
understands what he means, the trainees nod their heads
and take notes.
Did Tahl provide the correct definition? And if so, is
it important in health care? From the following, select
the best description of the coefficient of variation:
A. The capability of a process
B. Whether a process is in or out of control
C. The peak level of a distribution
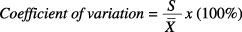
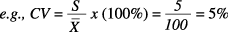
D. The ratio of the standard deviation to the mean
D is correct.
Coefficient of variation is a measure of how much variation
exists in relation to the mean. Dr. Tahl’s guess was
a meaningless collection of jargon. By obfuscating this
simple technique, he was in fact robbing his trainees of
the opportunity to gain another tool for data analysis.
Standard deviation alone isn’t particularly useful
without a context. For example, knowing a standard deviation
is 1.76 has no meaning, but understanding that a standard
deviation of 2 had been anticipated provides a context that
recognizes the variability is less than expected. Knowing
the standard deviation has historically been 0.5 or less
for a particular dimension, on the other hand, would suggest
that 1.76 is considered high.
In examining the ratio of a standard deviation to a mean,
the coefficient of variation provides a reference.
If the number is large, the data have much variability
with respect to the mean.
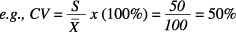
A smaller number reflects a small amount of variation
relative to the mean:
Michael J. Cleary, Ph.D., founder and president of
PQ Systems Inc., is a noted authority in the field of quality
management and a professor emeritus of management science
at Wright State University in Dayton, Ohio. A 29-year professorship
in management science has enabled Cleary to conduct extensive
research and garner valuable experience in expanding quality
management methods. He’s published articles on quality
management and statistical process control in a variety
of academic and professional journals.
|