| by Tony Grichnik, Thomas Hill, Ph.D., and Mike Seskin
The market for new analytical methods for statistical process control (SPC) and optimization is driven by a number of factors. In particular, companies that have invested in Six Sigma leadership, training and cultural development have emphasized quantitative assessment and problem solving. Using traditional Six Sigma tools and processes, they've realized significant improvements and cost savings. They've also recognized that a number of significant manufacturing problems are still unsolved.
Manufacturers are look- ing for ways to apply quantitative analysis to help their employees create better products. These companies are clear about their business objectives and have the historical data to characterize their problem domains. What they lack are methods to gain the insights necessary to approach these problems.
Traditional methods such as design of experiments (DOE), linear regression and correlation, and quality control charts aren't suitable in many circumstances for a variety of reasons:
• The number of relevant factors is large.
• The underlying relationship between the factors and critical outcomes is complex.
• The important factors interact with each other.
• The nature of the data violates the assumptions.
Data-mining methods can offer effective solutions to manufacturers facing these problems. Although data mining has been widely adopted in other industries, applying it specifically to manufacturing has been hindered by a lack of required expertise, the need to constrain solutions to practical implementations, the tendency to optimize outcomes to target specifications, the creation of the necessary tools to allow engineering professionals to perform what-if scenarios, and the absence of other tools to deploy predictive models to the factory floor for ongoing monitoring and decision making.
The return on investment from applying data mining in manufacturing has resulted in improved product performance, less scrap and rework, decreased testing, improved product performance, and fewer field service and warranty claims. Data-mining methods can provide significant value to all the data collected, stored and managed by manufacturers during the last several years.
During the 24 years that principle manufacturing engineer Bill Matthews has worked at Caterpillar Inc., he's seen products fail quality tests for many reasons. "We found that some of what contributed to product failures was tribal knowledge," says Matthews. "So now we use software to look at empirical data from our manufacturing processes equipment in relation to product performance, which gives us a much more accurate idea of what contributes to product compliance."
Like many large companies, Peoria, Illinois-based Caterpillar has developed sophisticated data-collection techniques. A single manufacturing plant can use thousands of gages, sensors and other automated devices to collect data from machines and other manufacturing equipment. But much of the massive amounts of data the company collected for monitoring hundreds of process parameters went unused.
Beyond the data was the dilemma of what to do to improve quality. What knobs get turned and in which direction? What design feature gets modified and by how much? What exactly in the manufacturing stream gets adjusted, altered, tuned or tweaked to positively affect quality and compliance outcomes?
Using predictive data mining on their mountains of data, Caterpillar's quality managers uncovered the manageable process parameters most important to the quality outcomes of finished products. Tribal knowledge, which contributed to process variation, was now consolidated and focused by providing a line of sight between the manufacturing processes and the finished product. By distilling the relevant relationships from a large candidate pool of data, the manufacturing process was fine-tuned to consistently produce a finished product that met engineering and customer requirements without added costs.
Building on years of experience with SPC and Six Sigma quality initiatives, engineers at Caterpillar are now deploying data-mining software developed with StatSoft Inc. ( www.statsoft.com) of Tulsa, Oklahoma, that answers questions about enterprisewide quality control and improvement. To date, the software has helped Caterpillar's manufacturing and design engineers use empirical data for quality improvements.
When the software was implemented on a Caterpillar rotating assembly found in industrial machine equipment, the results were improved product quality and streamlined manufacturing processes that produced cost savings in many categories. When engineers set out to solve an intermittent vibration problem found in some engines, they applied the define, measure, analyze, improve and control (DMAIC) methodology to the problem.
During the "measure" phase, engineers examined what data were useful to consider in relation to the vibration problem, which drove unnecessary cost by interrupting the finished product testing to "trim balance" the rotating assembly. Here, the abundance of data included 113 different assembly features measured during the manufacturing process. During the "analyze" phase, Caterpillar distilled these raw data down to a subset of predictor variables--such as clearances and fits in the rotating assembly that affect trim balance in an engine.
The data were categorized as input, output or constraints data, and the software then predicted a subset of variables that caused trim balance outcomes during finished product testing. To validate predictions, the software simulates the probability of trim balance problems. If the simulation results meet a minimum criteria for accuracy and uncertainty for validation, the software then optimizes the model to minimize trim balance.
Moving into the "improve" phase, engineers used the information rendered in the software's Actionable Decision Environment to explore what-if alternatives. In Caterpillar's case, the model revealed six assembly features that could affect trim balance. Engineers explored scenarios for implementing cost-effective changes using the actionable decision environment and determined that making two of the changes would have a disproportionately high effect on reducing the frequency of trim balance problems.
The actionable decision environment indicated what actions would produce the desired outcome. "The model allowed the Caterpillar team to determine that a reduction in run-out of two interacting features on the assembly would reduce [the occurrence of] trim balance problems by approximately 50 percent," says Matthews. The necessary manufacturing process changes were implemented to reduce the run-out in these features. "It was especially beneficial that the software model could provide us with an empirical line of sight between what we do during the assembly process and its effect on finished product," notes Matthews. "The tribal knowledge that previously contributed to process variation now seamlessly shifted to minimize the variation of features known to contribute to trim balance. The process changes were implemented with no additional cost of resources."
It's important to point out that although a reduction in trim balance problems was the single requirement in this example, many problems tend to be more complicated because they have competing requirements. The software's simultaneous optimization module effectively addresses these situations. For example, industrial machinery typically has power, fuel efficiency and emissions requirements. The software finds the optimum balance among competing goals by giving ranges of inputs relative to the desired outcomes.
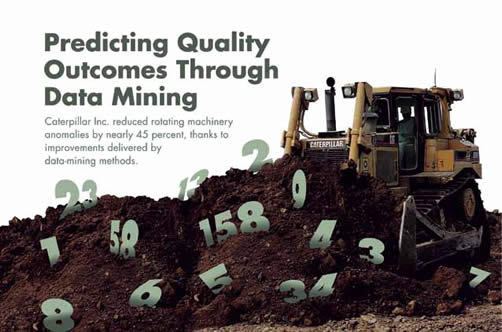
The results of using purposeful data mining for this particular Caterpillar rotating assembly included a 45-percent reduction in trim balance problems. Beside the typical reduction costs associated with finished-product discrepancies, such as reduced rework and scrap, and less visible effects such as increased throughput, a decrease in resources required to support testing also materialized. Additional return on investment (ROI) is derived from the fact that useful and actionable data were distilled. The investment in metrology equipment to collect data, storage and management applications for the data, and the added product cycle time to collect the data are just a few of the costs that are easily recovered when the data are converted to knowledge and useful actions.
Caterpillar reduces post-manufacturing product adjustments and effectively speeds time to market because it "predicts" the manufacturing process parameters driving the need for expensive and time-consuming product adjustments. More ROI is achieved through cost savings from the reduction in personnel and time previously used to perform the adjustments.
The term "data-mining methods" refers to a category of analytical methods geared toward determining useful relationships in huge, complex sets of data. The term arose partially to distinguish these methods from traditional statistical ones.
The interest in data-mining methods originally began in nonmanufacturing domains through a set of interrelated developments:
• Data storage. Relational database management systems have become commonplace during the last few decades. Storage hardware continues to be more scalable and less expensive. As a result, companies can collect, store and manage more data effectively. Whereas analyses and decisions in the past were limited to small data sets dealing with an immediate issue, opportunities now abound to build predictive models holistically using the available historical data.
• Computing power. At the same time that databases have matured and storage is becoming less expensive, the power available on standard workstation computers continues to improve. Knowledge workers today have a comparatively large amount of computing power available to them in terms of processor speed, working memory and hard-disk space.
These factors have contributed to organizations' readiness to adopt a new set of analytic methods to address data-mining opportunities. Originally, applications for data mining of business problems weren't found in manufacturing or quality-related disciplines but rather with credit-risk scoring in financial services companies, customer up-selling and cross-selling, and customer-retention applications in marketing domains. Quality practitioners in manufacturing are now realizing the applicability and advantages of these methods to their databases. The wealth of existing data in SPC software databases provides a great opportunity to derive valuable insights about a company's processes and how they contribute to product quality outcomes.
A popular category of data-mining methods is recursive partitioning, often called "tree" methods because the graphical outputs from these methods resemble a tree. Tree methods come in different algorithms, including classification and regression trees (C&RT) and chi-squared automatic interaction detectors (CHAID). This means that data-mining practitioners should apply multiple methods to the same problem to determine which provide the best predictive accuracy.
Tree methods are popular for predictive data mining because:
• They're nonparametric and will model both simple (e.g., linear) and complex (e.g., nonlinear) relationships, including interactions between factors and data sets with variables that aren't normally distributed.
• They train fast, even on large data sets.
• They're easy to interpret. Reviewing a tree graph entails simply studying a series of if/then statements.
Data mining is an analytic process designed to explore large amounts of data in search of consistent patterns or systematic relationships between variables, and then validating the findings by applying the detected patterns to new data subsets. The ultimate goal of data mining is prediction. Predictive data mining is the most common type and the one with the most direct business applications.
The process of data mining consists of three stages: initial exploration, model building or pattern identification with validation and/or verification, and deployment (i.e., applying the model to new data to generate predictions).
• Stage 1: exploration. This stage usually starts with data preparation, which may involve cleaning data, data transformations, selecting subsets of records and--in the case of data sets with large numbers of variables (or "fields")--performing preliminary feature selection operations to bring the number of variables to a manageable range, depending on the statistical methods being considered.
• Stage 2: model building and validation. This stage involves considering various models and choosing the best one based on its predictive performance (i.e., explaining the variability in question and producing stable results across samples). This might sound like a simple operation, but it can involve a very elaborate process. To achieve this goal, a variety of techniques have been developed, many of which are based on so-called "competitive evaluation of models," that is, applying different models to the same data set and then comparing their performance to choose the best.
• Stage 3: deployment. This final stage involves using the model selected in the previous stage and applying it to new data to generate predictions of the expected outcome.
The data-mining process aligns very well with the DMAIC methodology. In fact, many predictive modeling projects in manufacturing follow the DMAIC project process and include the data-mining steps of modeling (analyze), validation (analyze), and deployment (improve and control).
Typical analytical tools in the Six Sigma practitioner's toolkit for SPC are quality control charting, design of experiments and multiple linear regression. Data-mining methods can augment these methods in circumstances where historical data are abundant and a predictive model between input factors and quality outcomes would derive business benefits. In fact, a predictive data-mining model is often instrumental in determining the important factors driving product quality that should be monitored through quality control charting.
Predictive data-mining methods augment traditional SPC for a variety of reasons. First, they're robust enough for complex, nonlinear and non-normally distributed data scenarios. With traditional methods, it's important that the analyst checks assumptions to ensure that the method can be used and the interpretation of results is justified. With predictive data mining, those assumptions (often not met) are no longer relevant.
Second, predictive data-mining methods are holistic and multivariate. When reviewing a standard quality control chart, for example, the data under scrutiny are univariate (i.e., for one process parameter or one quality dimension in isolation). In contrast, a predictive data-mining model will take into consideration multidimensional relationships between the predictors and one or more quality outcomes, so the analyst is provided with a holistic understanding of how the process, from raw materials through process steps and in-process tests, contributes to the product attributes important to customers.
Third, predictive data-mining methods make use of historical data. Many companies have invested heavily in data capture, collection, storage and management. Predictive data-mining methods are used to derive a ROI for these data. In contrast, design of experiments requires that a project team defines and conducts experimental runs to derive its data.
A breakthrough in Caterpillar's approach overcame a critical barrier in attempting to deploy data mining in manufacturing: making the recommendations from the specific predictive models relevant to practical implementation.
Quality process managers, manufacturing engineers, design engineers and other decision makers at Caterpillar manipulated process settings on virtual models to observe the effect on product quality outcomes. For example, setting a particular process parameter at its theoretical optimum might require a costly upgrade to the production process not justified by the benefits of the change. Or, it might be beyond the capabilities of the materials supplier. In either case, the quality decision makers could see the likely outcomes that affect product quality. Interacting with the model helps participants see opportunities to add their collective expertise to the software predictions and derive reality-based settings for optimal quality results.
Included with the Actionable Decision Environment is a set of graphical tools to help users interact with the virtual process models. The interface is a mechanism that allows users to poke the model with what-if scenarios so that they can see the implications of their actions.
Using this approach, Caterpillar engineers were able to simultaneously improve multiple, competitive outcomes (e.g., power vs. fuel efficiency) driven by multiple upstream processes.
At the same time and equally important, the software helped Caterpillar identify processes where additional variation could be allowed with no penalty in product quality. The upside of the findings is simple: Why spend money and time to control a material or process variable when it doesn't contribute to product quality?
The application of data-mining software is relevant in complex manufacturing processes that involve many steps in different and diverse industries. The software can model relationships between specific manufacturing process parameters and outcomes even when data are sparse and relationships complex.
Manufacturing operations that have spent the last several years investing in measurement and data-storage systems are candidates for adopting data-mining and predictive modeling software. The software builds on existing data-collection methodologies and makes full use of the data already collected and stored.
Manufacturing industries adopting data mining for predictive modeling and optimization of their processes include heavy equipment, automotive, aerospace, machine tool, packaging, pharmaceuticals, robotics, semiconductor, medical and others with complex products.
Tony Grichnik is part of Caterpillar's Technology and Solutions Division. He received his bachelor's degree in manufacturing engineering with honors from Valparaiso University and graduated from the University of Chicago's New Entrepreneur's Program in 2004. While working at Caterpillar Inc., he developed technologies leading to 16 patents in manufacturing-related applications of artificial intelligence. He's currently working in business development and valuation at Caterpillar and collaborates with Bradley University's computer science department as a visiting scientist in artificial intelligence.
Thomas Hill, Ph.D., is vice president of analytic solutions development at StatSoft Inc. He has more than 20 years of experience in data analysis for applied and basic research, quality and process control, organizational development and survey research. He's the co-author with Pawel Lewicki of the textbook Statistics: Methods and Applications (StatSoft Inc., 2006).
Mike Seskin is a Six Sigma Black Belt at Caterpillar, where he's spent the last six years developing and applying artificial intelligence technologies to improve products and processes. He has 15 pending patents in this field. He holds a bachelor's degree in manufacturing engineering from California Polytechnic University. |