Blowing Hot Air
Michael J. Cleary, Ph.D.
mcleary@qualitydigest.com
In September’s column,
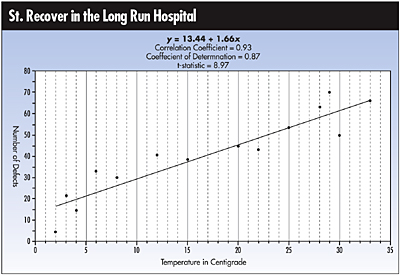
we saw Hy Sedrate run regression analysis on the relationship
between the number of defects in lab reports and the ambient
air temperature of the lab. As a quality specialist for
St. Recover in the Long Run Hospital, he had set out to
decrease the defect rate, and he wanted to test his theory
about the temperature. His scatter diagram showed a clear
relationship between the two factors, but even more important,
he learned what regression analysis actually is.
Sedrate is not known for his depth of analysis but rather
for his showy style. A fast talker, he’s able to persuade
those around him that he knows what he’s talking about
even when he’s dead wrong. The scatter diagram that
he stumbled onto to show the relationship between defects
and temperature had wowed his superiors. Based on Sedrate’s
chart, they invested in new air conditioning for the lab--just
in time for the summer humidity that the lab workers hated.
Those who benefited from the enhanced atmosphere felt that
they owed it all to Sedrate and his chart.
With this success under his belt, he prepares an elaborate
PowerPoint presentation in the interest of explaining regression
to his peers and proving himself an expert in statistics.
Sedrate displays the equation used to calculate a regression
line:
His audience is truly impressed with the presentation,
complemented by rising music in the background and fades
into elements of the equations. As he’s closing, a
quality specialist, Hap N. Stance, asks the meaning of the
coefficient of determination of 0.87. Sedrate has no idea,
but he reviews the PowerPoint slides once again for the
benefit of his audience, which is becoming smaller with
each repeated slide. Finally, he says with his usual air
of confidence, “The 0.87 coefficient means that there
is little determination between the two variables.”
Is Sedrate correct?
As usual, Sedrate is incorrect.
He has missed an opportunity to explain one of the few
statistical tools that he could articulate in words. The
coefficient of determination is the percent of variation
in (the dependent variable) that can be explained by (the
independent variable). Thus, if the coefficient of variation
is 1.0, all the variability in y could be explained by x.
A diagram that is used in many textbooks can be an aid in
visualizing this concept:
As the diagram shows, the regression line explains some
of the variability of  , ,
but not all. In Sedrate’s case, the coefficient of
determination is 0.87. He should have informed his audience
that 87 percent of the variability of defects can be explained
by the temperature, rather than simply insinuating that
temperature totally explains defect rate.
Michael J. Cleary, Ph.D., founder and president of
PQ Systems Inc., is a professor emeritus of management science
at Wright State University in Dayton, Ohio. He’s the
author of several articles on quality management and statistical
process control. Letters to the editor regarding this column
can be sent to letters@qualitydigest.com.
|