Call Me Old-Fashioned--Part 2
You’ll recall that Part 1 presented a decision about which supplier to use based on sample statistics and capability indexes calculated from product supplied by four vendors. Your local statistical guru did a thorough analysis that made the decision seem clear. But then you noticed the control charts supplied by each vendor with its lot (below), all of which use a subgroup size of n = 5.
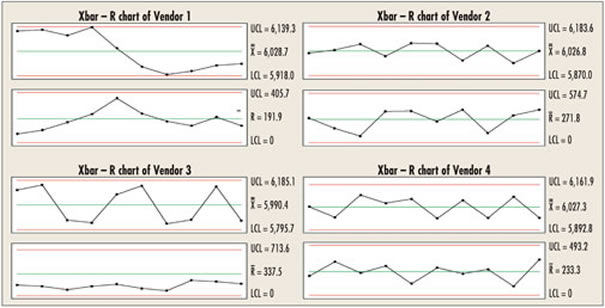
Do these control charts help? The statistical guru said that all the points were inside the limits, so his analysis using normality tests, capability indexes, analysis of variance and 95-percent confidence intervals were more powerful and sophisticated.
But you’re not convinced. You decide to ask each vendor, “How did you collect your data?”
 Vendor one: “We wanted to make sure that you had a representative sample of product, so we sent 25 parts from one lot and 25 parts from another. Our control chart program shows everything within the limits, and all the parts are within the specification frame. As you see, our Cp and Cpk are looking relatively good.” Vendor one: “We wanted to make sure that you had a representative sample of product, so we sent 25 parts from one lot and 25 parts from another. Our control chart program shows everything within the limits, and all the parts are within the specification frame. As you see, our Cp and Cpk are looking relatively good.”
The vendor was obviously being dogmatic about the “one point outside three standard deviations” rule--one can see two processes. Hence, the summary calculations are inappropriate, as are the capability index calculations. The process average, as calculated, doesn’t exist.
Vendor two: “We sampled five consecutive parts per hour during the 10-hour production run. The process was in control, and all the parts are within specification.”
You can probably predict that the next batch will be consistent with this one, but what about the variation it adds to your process?
Vendor three: “We ran two different machines and periodically sampled 10 consecutive parts, alternating between machines. When we realized that we were at the end of the run, we sampled five from each machine for the last sample. Our control chart software initially showed some out-of-control points, but because all the product was within specification, we just calculated the standard deviation of the 50 samples to see if using that would bring the chart into control. It did, so that’s the analysis we used. However, we did use the R bar/d 2 from the original control chart for the Cp and Cpk calculations.”
Further analysis shows that each machine is set at a different process average, and the standard deviation of the machine with the higher average is almost twice that of the other machine.
Vendor four: “We have state-of-the-art technology that produces 10 parts at once and allows just-in-time delivery. We sampled one of these 10-part clusters five times, spaced evenly throughout the run. Even though the chart was in control, we subsequently noticed that there seemed to be an out-of-adjustment cavity at the same position in the data for every sample. We discovered and fixed a maintenance issue."
If future production is consistent with this run, the process standard deviation will be approximately 74.4--making Cp 1.34 and Cpk 1.10. The special cause for this process made the control charts appear in control even though they weren’t. Note the alternating nature of the R-chart. The second sample of five within the cluster of 10 always contained the outlier, causing an inflated estimate of the standard deviation, which inflated the limits on the X-bar chart. And, given the way the data were collected, the R bar/d2 technique to estimate the standard deviation isn’t appropriate.
Except for vendor two, the statistical analysis/summary had no value. Comparisons via normality tests, analysis of variance, means, standard deviations, histograms, 95-percent confidence intervals and capability indexes were inappropriate given the processes that produced their data. This lends credence to the observation, “If I stick my right foot in a bucket of boiling water and my left foot in a bucket of ice water, on average, I’m pretty comfortable.”
Davis Balestracci is a member of the American Society for Quality and the Association for Quality and Participation. He previously served as chair of the statistics division of ASQ. Visit his Web site at www.dbharmony.com.
|
