Beware of a Common Financial Trap
In my last two columns, I’ve emphasized the simple process of “plotting the dots” via a run chart—a time-ordered plot of data with the median drawn in as a reference line—and using the two following rules to determine whether a process has exhibited a significant shift during the time period:
 A trend of seven consecutively increasing or decreasing points A trend of seven consecutively increasing or decreasing points
A cluster of eight consecutive points either all above or below the median
Wait a minute! As I also mentioned in previous columns, be sure to ask these necessary preliminary questions:
How were these data collected?
Is this analysis appropriate, given the way the data were collected?
With that in mind, how would you analyze the three processes below?
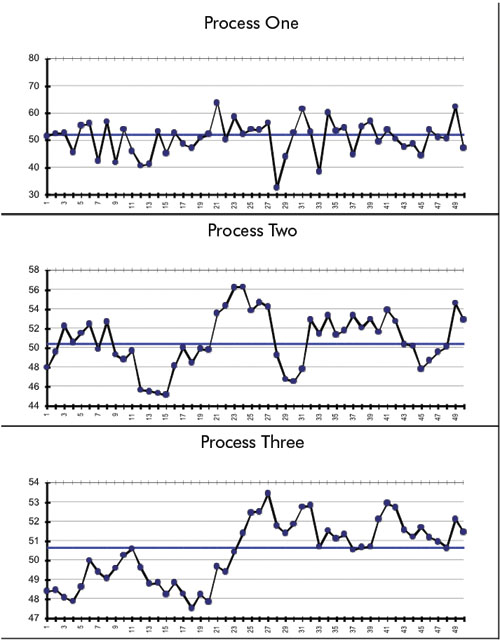
Actually, these are three plots of the exact same data. How can that be, you ask? Well, I’m going to tell you how these data were collected.
I generated 61 random, normal observations.
Process one is a run chart of observations 12 to 61, i.e., the last 50 observations. As you see, there are no special causes if you apply the two rules.
Process two is the same data except for one thing: I’ve “rolled” three previous observations into each data point, similar to a very common technique used in financial data, the four-quarter rolling average. The first data point is the average of observations nine to 12, the second data point averages observations 10 to 13 and the final data point averages observations 58 to 61. So it’s indeed a plot of observations 12 to 61.
Process three is similar to process two except that 11 previous observations have been rolled into each data point. This is similar to the very common 12-month rolling average. (Usually the basis for determining days outstanding for accounts receivable.) The first data point is the average of observations one to 12; the second data point averages observations two to 13 and the final data point averages observations 50 to 61. So, it too is a plot of observations 12 to 61.
As you see in these latter two plots, the two statistical rules have multiple violations; however, because of the “memory” inherent in each data point of these latter two processes, the usual runs analysis is inappropriate for the way these data were collected. Control charts, which would also demonstrate rampant instability, would be equally invalid.
I then proceeded to generate 61 more observations from the same process. As you can see, the first plot merely confirms this stability when compared to the first plot in the previous figure. I then proceeded to generate and plot the rolling averages of four and 12, respectively. Note that the result is a totally different picture from previous ones—and equally incorrect.
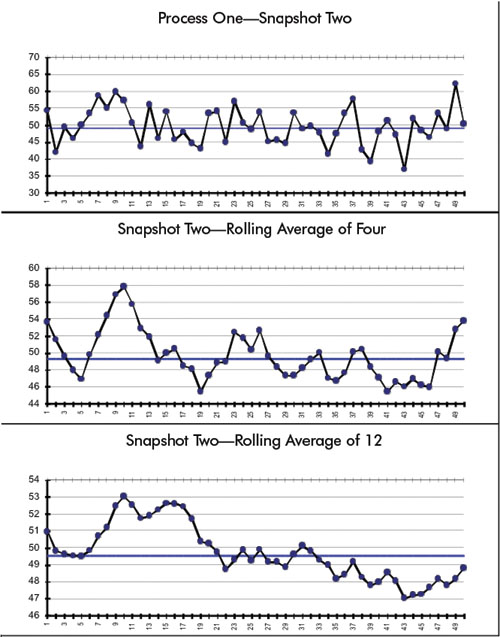
The point is, even though the underlying process is stable, “rolling” the figures creates the appearance of rampant instability—all in the name of innocently trying to reduce variation through smoothing them. As W. Edwards Deming was so fond of saying, “Simple… obvious… and wrong!” This also creates extra, nonvalue-added work in an organization when explanations for these “trends” are demanded… and found… and acted upon. And Wall Street does love that 52-week rolling average. As you can see, mathematical manipulations don’t make a process’s inherent variation disappear. “It is what it is,” and must be understood so that appropriate action can be taken.
Davis Balestracci is a member of the American Society for Quality and the Association for Quality and Participation. He previously served as chair of the statistics division of ASQ. His book, Quality Improvement: Practical Applications for Medical Group Practice (Center for Research in Ambulatory Health Care Administration, 1994), is in its second edition. Visit his Web site at www.dbharmony.com.
|
