Five Easy Samples
Michael J. Cleary, Ph.D.
mcleary@qualitydigest.com
Dr. Tad E. Gotistic is confident
of his ability to instruct the emergency room nursing staff
at St. Recover in the Long Run Hospital in the fundamentals
of statistical process control, despite the fact that he
understands how to use X-bar and R charts but little else
in the way of statistical applications. However, he assumes
that the staff doesn't know as much as he does, and that
gives him an advantage. At least, that has always been the
case whenever he's had to prove his knowledge in a variety
of areas.
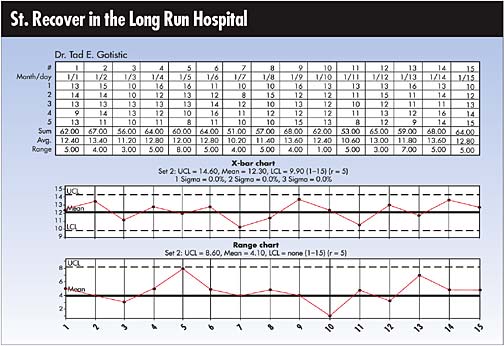
During the seminar in which Gotistic learned about charting,
the instructor provided an example using 15 samples of five
each, and Gotistic employs the same example when instructing
the nursing staff. Illustrated below is the chart he uses
in the class.
Gotistic created X-bar and R charts and was deeply involved
in deriving control charts when one of the nurses asked
why he'd selected a sample size of five. "Why not six
or seven or even 10?" This nurse had, in fact, also
participated in a seminar that offered an overview of SPC,
and the instructor had used a sample size of five in that
instance as well.
Gotistic had a ready answer, asserting that selecting
a sample size of five was required for statistical precision,
obliquely suggesting that any other sample size would be
flawed in its statistical calculations. "Trust me,"
he said, "This is statistically sound."
Why is using a sample size of five conventional practice?
a. It's grounded in statistical accuracy, as Gotistic asserts.
b. Using a sample size of five is the most economical choice.
c. A sample size of five renders the arithmetical calculations
more convenient.
d. A sample size of at least five creates validity, but
there's no magic in the number itself.
Answer c is correct. A sample size of five allows for a
shortcut to calculate the average. Five is the conventional
sample size not because of its link to any statistical principle,
but because it makes calculations more convenient.
By taking the sum of the samples, multiplying by two and
moving the decimal point one place to the left, the same
result ensues, as illustrated:

Moving the decimal one place to the left generates 12.4.
Remember that the control chart was developed during the
1930s, long before affordable calculators or PCs were available
for statistical calculations.
By the way, don't confuse your grade-school kids by introducing
them to this "new" way of calculating averages.
This method works only if the sample size is five.
Michael J. Cleary, Ph.D., founder and president of
PQ Systems Inc., is a noted authority in the field of quality
management and a professor emeritus of management science
at Wright State University in Dayton, Ohio. A 29-year professorship
in management science has enabled Cleary to conduct extensive
research and garner valuable experience in expanding quality
management methods. He has published articles on quality
management and statistical process control in a variety
of academic and professional journals. Letters to the editor
regarding this column can be sent to letters@qualitydigest.com.
|