2007 Resolutions: Weight and… Budget? (Pt.1)
I've resolved to lose 20 pounds this year, just like I did last year (resolve, that is) and the year before that… and… well, you know. I know what I should do: Change my diet, exercise, etc., but darned if my best intentions get sidetracked… again! My weight doesn't lie; my lifestyle process is perfectly designed to keep me at my current weight because I consume what I consume.
How much executive and management time is spent on budgeting, then managing (and revising) your organization's budget? Twenty percent? Thirty percent? All managers know what they should do come forecasting time, but darned if their best intentions get sidetracked… again! Spend-
ing patterns don't lie: The organization's current processes are perfectly designed to consume what's being consumed.
 The following example is from a friend of mine who attended meetings every two weeks to see how she was doing vis-à-vis her budget. You all know these meetings: The manager goes around the table, asks why you're either over or under your budget (usually the former) and demands, "What are you going to do about it?" The following example is from a friend of mine who attended meetings every two weeks to see how she was doing vis-à-vis her budget. You all know these meetings: The manager goes around the table, asks why you're either over or under your budget (usually the former) and demands, "What are you going to do about it?"
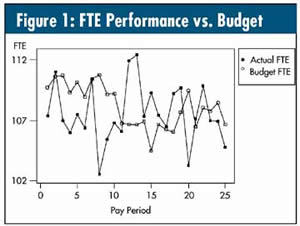
A graph I see over and over again is the simultaneous plotting of actual performance vs. budget--also known as a "mating earthworm plot." Figure 1 shows my friend's budget performance regarding her paid full-time equivalent (FTE) time. Note the recent string of 10 out of 11 periods above budget, although she exonerates herself because the last three periods are below budget.
How much of your time is spent at meetings where performance-vs.-budget graphs like this are presented? Or bar graphs, stacked bar graphs or crazy-making tables titled "This Month," "Variance to Budget ($)," "Percent Variance," "Last Month," "12 Months Ago," "Year-to-Date" and "Year-to-Date 12 Months Ago"? When people at these meetings start drawing little circles, and others start covering their tails, leave.
My friend knew better than to try to fool me, so I asked her for the data. I plotted the two run charts seen in figure 2. The one on the left is a run chart of her actual performance, and the other is a plot of this actual performance minus the budgeted performance.
Her process was perfectly designed to get the results it has always gotten.
How can this make sense? What about the special cause in the graph on the right (observations 12–19 above the median)? Well, there was a process change… of sorts. (More about that next month.)
Meanwhile, what about all these meetings and other daily meetings like them? Business consultant Mark Graham Brown (see his book titles below) has done some research that shows the potential for waste reduction, if these meetings and their stacked bar, crazy-making, happy-face-sad-face tables were done away with:
• 80-percent reduction in monthly corporate financial reports
• 50-percent reduction in monthly senior management meeting time
• 60-percent reduction in daily pounds of published performance reports ("backup data")
• Up to one hour eliminated each day of managerial review and attempts to interpret unimportant performance data
What could these do for your own quality improvement efforts?
Note: The Mark Graham Brown books referred to in this article are Keeping Score: Using the Right Metrics to Drive World-Class Performance (American Management Association, 1996) and Winning Score: How to Design and Implement Organizational Scorecards (Productivity Press, 2000).
Davis Balestracci is a member of the American Society for Quality and past chair of its statistics division. He's also a dynamic speaker with unique and entertaining insights into the places where process, statistics and quality meet. Visit his Web site at www.dbharmony.com.
|
