Are You Using SWAGs?
I’m not a fan of “required” statistics courses. Most are taught from an inherent research perspective and are nothing short of legalized torture resulting in participants learning to turn any wild a** guess (WAG) into a statistical wild a** guess (SWAG).
Published rankings with feedback are very often used as a cost-cutting measure to identify and motivate “bad apples.” Some are even derived, er… uh… “statistically?”
In an effort to reduce unnecessary expensive prescriptions, a pharmacy utilization proposal was developed to monitor and compare individual physicians’ tendency to prescribe the most expensive drug within a class. Data were obtained for each of a peer group of 51 physicians: the total number of prescriptions written and, of that number, how many were for the target drug.
A pharmacy administrator proposed the following analysis:
• Test data for the normal distribution.
• If distribution is normal, physicians whose prescription tendencies deviate greater than one or two standard deviations from the mean are identified as outliers.
• If distribution isn’t normal, examine distribution of data and establish an arbitrary cutoff point above which physicians should receive feedback. (This cutoff point is subjective and variable based on the distribution of ratio data.)
 The scary issue here is the proposed ensuing “analysis” resulting from whether the data are normal. If data are normally distributed, doesn’t that mean that there are no outliers? But suppose outliers are present--doesn’t this mean they’re atypical? In fact, wouldn’t their presence tend to inflate the traditional calculation of standard deviation? But wait, the data passed the normality test… it’s all so confusing! The scary issue here is the proposed ensuing “analysis” resulting from whether the data are normal. If data are normally distributed, doesn’t that mean that there are no outliers? But suppose outliers are present--doesn’t this mean they’re atypical? In fact, wouldn’t their presence tend to inflate the traditional calculation of standard deviation? But wait, the data passed the normality test… it’s all so confusing!
Yet that doesn’t seem to stop our “quality police” from lowering the “gotcha” threshold to two or even one standard deviation to find outliers (a very common practice I’ve observed).
Returning to the protocol, even scarier is what’s proposed if the distribution isn’t normal: Establish an arbitrary cutoff point (i.e., one that’s subjective and variable).
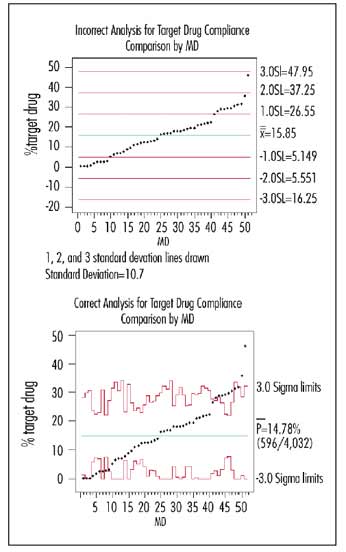
Because the data pass the normality test, the graph at the top right shows the suggested analysis with one, two and three standard deviation lines drawn in around the mean. (The standard deviation of the 51 numbers was 10.7.)
I generated a p-chart for this same data (bottom right graph). Note that the conservative three standard deviation limits calculated correctly are usually comparable to the one standard deviation limit of the incorrect analysis. Another difference: The overall “system” value obtained from the aggregated summed numerators and denominators of the 51 physicians was 14.78 percent, which differs from merely taking the average of the 51 percentages (15.85%).
Anyone outside his or her (correctly calculated) unique common-cause band is a probable special cause; these physicians are truly “above average” or “below average.” Note that physicians 48 and 49 could still be indicative of a process at 14.78 percent because of the number of prescriptions written.
Depending on the analyst’s mood and the standard deviation subjectively selected, he or she could claim to statistically find one--or 10--upper outliers, while there are actually eight probable outliers with a lot more certainty than a SWAG. Even worse, he or she could have just as easily used the WAG approach, decided that 15 percent was what the standard “should” be, and given feedback to the 27 physicians above 15 percent.
So, what should we conclude from our correctly plotted graph? Only that these outlier physicians have a different process for prescribing this particular drug than their colleagues, 75 percent of whom exhibit average behavior. For some physicians, this variation is appropriate because of the type of patient they treat, and for others it may be inappropriate (or unintended) due to their methods of prescription, but they don’t know it. Maybe collegial discussion (including the outliers who are below average) using this graph as a starting point would be more productive than public blaming and shaming.
Davis Balestracci has received awards for his innovative teaching and application of statistical methods, which are summarized in his book, Quality Improvement: Practical Applications for Medical Group Practice, (Center for Research in Ambulatory Health Care Administration, second edition, 1996). He’s a past chair of the ASQ's Statistics Division. Visit his Web site at www.dbharmony.com.
|
