Correctly analyzing data presented in table form is important because incorrect conclusions might lead to
tampering with a stable process or ignoring real problems. Therefore, statistical guidelines are necessary to help decision makers understand the numbers. Table 1 shows
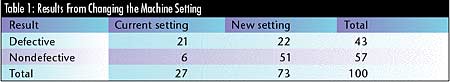
defective counts for two different machine settings. An analyst will have questions about randomness and control of other factors. However, let's assume that the data are valid and that we simply
wish to answer the question, "Do different machine settings result in statistically different defective rates?"
A common way to analyze data is to calculate and compare proportions. The percents defective for the two different settings are: P
current = 100 x 21/27 = 77.8%
Pnew = 100 x 22/73 = 30.1%
For most managers, the new settings look much better. The statistically inclined person, however, would ask for some additional guidelines. There are several options available:  The chi-square test
. The most commonly used approach to analyzing this table, which is called a 2 x 2 contingency table, is the chi-square test. Using MINITAB software, we obtain these results: The chi-square test
. The most commonly used approach to analyzing this table, which is called a 2 x 2 contingency table, is the chi-square test. Using MINITAB software, we obtain these results:
chi square = 18.252, DF = 1, P value = 0.000. The small P value indicates that the observed difference is statistically significant, i.e., it's probably not due to chance. Relative-risk and odds ratios
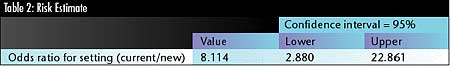
. The relative risk is the ratio of event probabilities for the subgroups of interest. For our data, the interesting relative risk is the ratio of
the probability of a defective for the current setting vs. the new setting, which is: 
Table 2 shows the relative-risk calculations performed by SPSS software. The table
also includes lower and upper confidence limits on the risk estimates. Because these estimates are multipliers, we'll consider a risk estimate to be statistically meaningful
if the confidence interval doesn't include 1, which ours doesn't.
Binary logistic regression.
Some statistics software, such as MINITAB, don't offer a direct analysis of odds ratios, such as the one performed above. However,
the software usually can perform an equivalent analysis by using binary logistic regression. Table 3 shows MINITAB's analysis of the data in Table 1.
This is exactly the same as the odds ratio for current vs. new that was calculated using relative-risk and odds ratios. When presenting the results, it's far easier to
explain if I don't use terms like "binary logistic regression" but rather stick to a discussion of ratios and their confidence intervals. Compare proportions using normal approximation. The normal distribution can
be used as an approximation to the binomial distribution to arrive at a P value. Using MINITAB to do this, we get the results shown in Table 4. The P value indicates that
the proportions are different between the two settings.
Exact tests.
So far, we've been able to get valid P values from all of the methods, but that won't always be the case. Look at what happens, for example, if the data
shown in Table 5 are analyzed using the chi-square test.
Note that the proportions and odds ratios are similar to what we obtained from Table 1, but the sample size for the "new" setting is much smaller. MINITAB's
analysis now indicates that there are two cells with expected counts less than five, which invalidates the chi-square analysis and casts doubt on the P value's validity.
You can no longer say with specific confidence that the two settings are different. One way of dealing with small samples is to use Fisher's Exact Test. Doing this
with SPSS, we obtain a P value of 0.024. This P value, though larger than the one obtained using chi-square analysis, is still significant at the five-percent level. There are many different ways to analyze data from tables. Choosing which is best depends on--among other factors--sample size, the audience to which the results
will be presented, and the costs of making various wrong decisions. This column describes analysis of 2 x 2 contingency tables. Although common, they're only one
type among many. In future columns I'll explore ways to analyze more complex tables. About the author Thomas Pyzdek is a consultant in Six Sigma. He has written more than 50 books and software and training products, including The Six Sigma Handbook
(McGraw-Hill, 2000). Learn more about Six Sigma at www.pyzdek.com . E-mail Pyzdek at tpyzdek@hotmail.com .
|