An Average Grasp of Distribution
One Palm Pilot vs. 1,000 random
samples
Michael J. Cleary, Ph.D.
mcleary@qualitydigest.com
Hartford Simsack, our intrepid
quality manager from Greer, Grate & Gate, has a limited
understanding of averages and has no intention of learning
more. He's fond of using the expression "on average"
to describe a variety of situations. If he has a week with
several bad days and a couple of good days, he feels that,
on average, it's been a decent week, with no need to explore
the concept further.
Dr. Stan Deviation, Simsack's statistics instructor at
the local community college, as well as his unwitting mentor,
has other ideas about averages. At first, Simsack doesn't
understand why Deviation goes on and on about averages.
So during the lectures, Simsack occupies himself with a
solitaire game that he has installed on his Palm Pilot.
His attention is piqued, however, when Deviation uses
a simulation model to demonstrate how averages behave. Because
Simsack is, on average, not doing well with solitaire anyway,
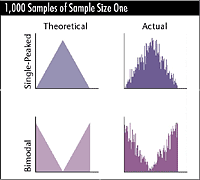
he perks up for the demonstration. The model takes 1,000
samples of various sizes from two populations. One is single-peaked
(i.e., one mode), and the other is bimodal (i.e., two modes).
 Simsack's
response to this is, "And that would be important because…?"
The simulation model creates 1,000 random samples of the
size of one: Simsack's
response to this is, "And that would be important because…?"
The simulation model creates 1,000 random samples of the
size of one:
Not surprisingly, those samples create distributions that
look similar to the populations they came from. Simsack
notices the contrast between the rather neat triangle represented
by the "theoretical" and the ragged representation
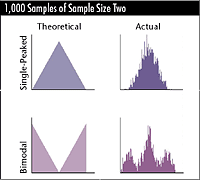
of actual data. Then Deviation hits the start button again,
and the simulation takes 1,000 samples of the size of two,
then averages those samples and plots the averages for both
populations.
The histogram of samples of two is tighter and higher,
a logical outcome as the sample size is two in this case.
The distinction is that the chart reflects 1,000 averages,
not 1,000 points.
Deviation asks his class to explain why the bimodal distribution
had become a trimodal distribution. Simsack, fascinated
by the colorful patterns that the data has created, but
not really engaged in the lesson, focuses intently on a
spot on the floor beyond his desk to avoid eye contact with
the professor.
If Deviation were to call on you, how would you respond?
While Simsack contemplates the imprint of his shoe on the
carpet, Deviation reminds the class of the multiplication
rule he had presented last week using a flip of a coin (which
we reviewed in June's column):
He then asks the class what the probability of getting
two heads would be. They respond one-fourth (0.25). When
he poses the question of probability of two tails, they
respond the same way.
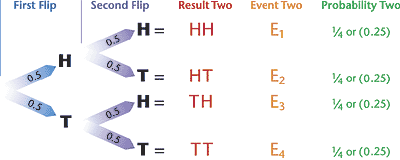
P(A and B) = P(A)(B) or P(T and T) = P(T) x P(T)
Reminding them that this is the multiplication
rule, he asks what the probability of one head and one tail
might be. One brave student notes that this could happen
in two ways (E2 or E3) or HT or TH. Using the same logic,
she says if those separate events have a one-fourth (25%)
probability, then the answer would be 50 percent. The professor
smiles because he's just presented the addition rule:
P(A or B) = P(A) + P(B) or
P(one head & one tail) = P(HT) + P(TH)
Thus, the trimodal distribution is now explained. The
center mode of trimodal distribution is made up of samples
that are from right left and left right.
In the bimodal distribution, a sample of two can come
from:
Left Left 0.25
Left Right 0.25
Right Left 0.25
Right Right 0.25
The Left Right and Right Left combined have a probability
of 0.50
Deviation was utilizing Quality Gamebox. Learn more at
www.pqsystems.com.
About the author
Michael J. Cleary, Ph.D. is a professor emeritus at Wright
State University and founder of PQ Systems Inc. E-mail letters
to the editor regarding this column to
letters@qualitydigest.com.
|