Social Sharing block
You know what really gets on my nerves? A lot of things.
|
ADVERTISEMENT |
That slow, slinky way that cats walk by. Grrrr.
The rude, abrupt arrival of delivery persons in their obnoxiously loud trucks. (Why do they always pull up just as I'm settling down for a nap?) Grrrr.
 |
Total strangers who reach down and poke me with fat, clumsy fingers that reek of antibacterial soap. Grrrr.
And this one always gets my dander up: Me and the human are out on a walk, when some passerby stops and points at me.
"What a cutie. How old is she?"
"What insolence!" I'll yap back. "I'm a he! And how old are you?!"
Then I'm told to shut up. Then the conversation continues.
"He's 7."
"Oh, so that means he's... 7 × 7 = 49 years old in dog years."
I have a bone to pick with oversimplified estimation models like this. Not every relationship can be neatly described by a straight line, you know.
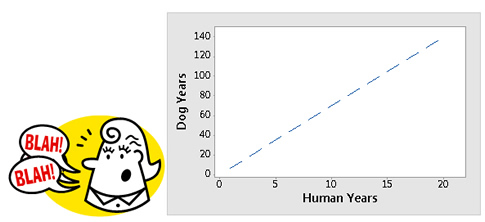
An oversimplified model of dog years
I know, I know, it's not the humans' fault. They just haven't been properly trained. So a lot of them think they can plot a few data points on an X-Y scale and plunk a strand of raw spaghetti over it to predict whatever they darn well please. That's something a Great Dane would do. Grrrr.
We Yorkies know that relationships can be much more complicated.
Look, I was completely potty trained at the age of two months. Human children, not the brightest, are lucky to get it by the time they're 3 years old. At three months, I could consistently comply with verbal requests to sit, stay, and lie down. Human children? Good luck with that!
In early life, there are at least 15 dog years to every human year! Maybe more.
And what about later life? Did you hear about the Australian cattle dog named Bluey who lived to be almost 30 years old? You mean to tell me he was over 200 years old in dog years? Grrrr.
My point? Even if a 1-to-7 relationship between human years and dog years generally holds true, you have to be doggone careful about extrapolating across all X-Y values. You need to carefully define the range of values for which your linear model holds.
Modeling data using quadratic or cubic functions
Another option is to break away from the straight-jacket. Consider using a quadratic or cubic function to model data that don't toe the line:
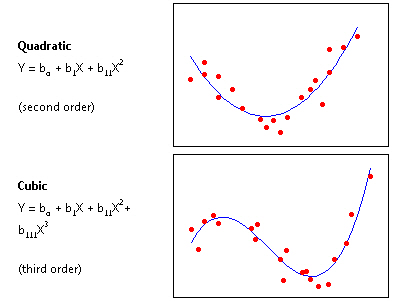
Being a fearless Yorkie, I'm not even afraid to consider using a more advanced nonlinear function, if it can provide a significantly better fit than a linear regression model.
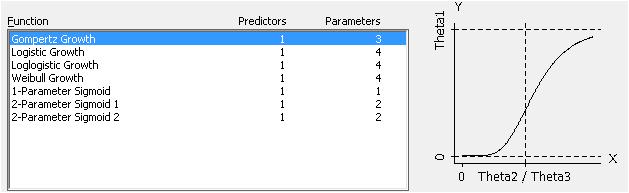
Like a sigmoidally shaped function:
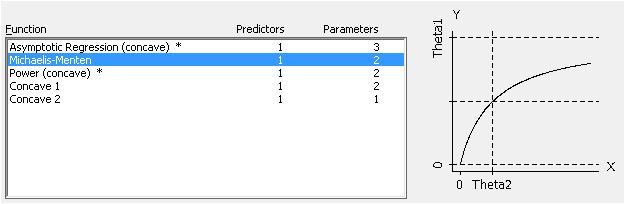
A concave function:
Or a function with local minima and maxima:
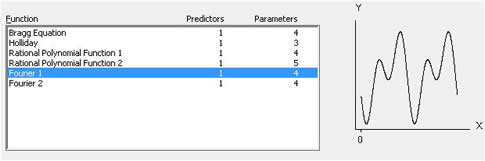
I could yap on and on about this, but then I'll be told to shut up. You can find these and other nonlinear functions in Minitab's catalog of functions for nonlinear regression (Stat > Regression > Nonlinear Regression > Use Catalog).
Are you ignoring breeds in your data?
There's another thing about that human years/dog years graph that really makes me froth at the mouth: It treats all dogs as a single population. We all know what happens when you make an inference based on single population when, in fact, your data are actually from distinct populations.
You get a one-size-fits-none estimate. Grrrrr.
The obvious trend in this bar chart makes my point:
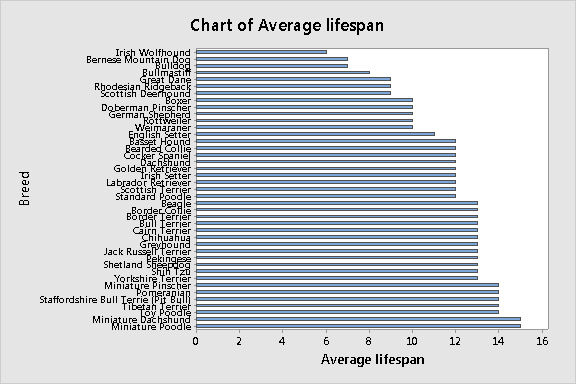
How could humans use the same model to estimate the "dog age" of an Irish wolfhound (average lifespan ≈ 6 years) and a miniature poodle (average lifespan ≈ 15 years)?
Do me a favor: Next time, instead of overestimating my age, at least use a model with a grouping variable that accounts for these distinct populations, would you?
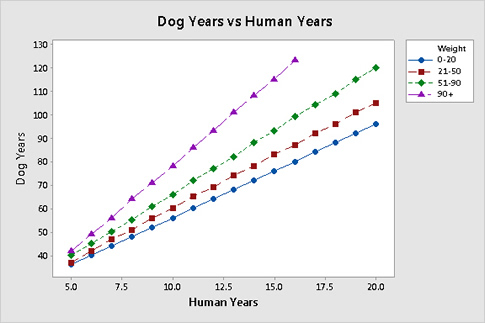
This model isn't perfect, either. I, for one, certainly don't appreciate being lumped together with dogs that weigh twice as much as I do.
And I hate to sound catty, but compared to some other breeds, I think I look much younger than my age.
Add new comment