All Features

Donald J. Wheeler
In part one we found the baseline portion of an XmR chart to be the best technique for identifying potential outliers among four tests with variable overall alpha levels. In this part we will look at tests which maintain a fixed overall alpha level regardless of how many values are being examined…

Anthony D. Burns
Augmented reality (AR) means adding objects, animations, or information, that don’t really exist, to the real world. The idea is that the real world is augmented (or overlaid) with computer-generated material—ideally for some useful purpose.
Augmented reality has been around for about 30 years.…

Donald J. Wheeler
The first statistical test was a test for outliers. The problem of what to do about outliers has been around from the beginnings of data analysis. Part one will compare four tests for outliers. Next month part two will cover some additional tests for outliers.
Statisticians know how to analyze…

Donald J. Wheeler
Every introductory class in statistics teaches how to obtain a global standard deviation statistic. While this descriptive statistic characterizes the dispersion of the data, it is not the correct value to use when looking for unusual values within the data. Since all of statistical inference is…

Donald J. Wheeler
On Sept. 29, 2020, the recorded worldwide death toll from Covid-19 reached 1 million. Six days earlier the United States reached 200,000 Covid-related deaths. So how did the United States with only 4 percent of the world’s population manage to capture 20 percent of the world’s deaths in this…

Eric Weisbrod
The idea of digital transformation can be scary. The growth of technology is outpacing a comfortable pace of adoption for many manufacturers. But remaining content with the status quo often means being left behind. Digital transformation has become an imperative to give manufacturing organizations…

Steve Wise
The importance of data analysis in manufacturing operations can’t be overstated. Over the years, manufacturers have used statistical process control (SPC) methods and tools to study historical data and reveal differences between comparable items: shifts, products, machines, processes, plants, lot…

Dirk Dusharme @ Quality Digest, Jason Chester
In previous articles of this series, we discussed how to master quality at the tactical and strategic levels. If you are like most readers, you probably nodded your head through article two’s tactical shop-floor view and vigorously shook your head through article three’s strategic view because…

Jason Chester
Before we get into a case study about how enterprisewide SPC software would work on both the shop floor and the C-suite, let’s talk about a long-held bias about “blue-collar” workers: That because they’ve traditionally been associated with manual labor, they should use manual tools; “white-collar”…

Ryan E. Day, Dirk Dusharme @ Quality Digest, Taran March @ Quality Digest
In order to best illustrate how enterprisewide SPC software can help address shop-floor problems and then funnel the captured data to the corporate level where strategic issues can be analyzed, here is a case study of a hypothetical manufacturing facility. In it, the company makes effective use of…

Eric Weisbrod
In recent months, we’ve learned that manufacturing during a global health crisis puts organizations under immense pressure to maintain operational efficiency while upholding product quality and employee safety.
Initially, organizations focused simply on taking the steps required to survive. However…

Dirk Dusharme @ Quality Digest
It’s been 40 years since “If Japan Can, Why Can’t We?”, W. Edwards Deming, and total quality management. More than 33 years have passed since the release of the first iteration of ISO 9001 (remember checklists?). For four decades the importance of building quality into processes rather than trying…

Taran March @ Quality Digest
In the intro to this series we noted that, too often, quality tools and the data we glean from them are used only to solve immediate, mostly shop-floor problems. These gold nuggets of opportunity aren’t used in an equally valuable way to address a company’s strategic goals.
Here we’ll consider how…

Ryan E. Day
If you're involved in business you know: Strategy matters. Your strategies guide you to reach your objectives. Behind every successful business are purposeful strategies. Then again, as Alvin Toffler said, “The absence of strategy is fine if you don’t care where you’re going.”
We’re talking…

Donald J. Wheeler
This article tracks the progression of Covid-19 over the past six months on a state-by-state basis and provides a framework for interpreting these curves by including curves for seven other countries. While 52 states and territories are covered here, it turns out that there are just three basic…

Donald J. Wheeler
In past articles I have used graphs to provide perspective on how the Covid-19 pandemic is progressing around the world. In this article I shall update some of those graphs and use these historical data to make projections on what may be expected in the United States in the fall.
The worldwide…

Betsy Mason, Knowable Magazine
This story was originally published by Knowable Magazine.
Imagine a science textbook without images. No charts, no graphs, no illustrations or diagrams with arrows and labels. The science would be a lot harder to understand.
That's because humans are visual creatures by nature. People absorb…

Donald J. Wheeler
Since the start of the Covid pandemic I have received many questions about how to analyze the Covid numbers using process behavior charts. Various schemes have been proposed and used. This column will discuss appropriate ways of analyzing data from epidemics and pandemics.
Now to be clear, in this…

Donald J. Wheeler
With data that come along one number at a time, it is easy to get lost in the details. To see the big picture, it helps to use a time-series graph that will draw your eye in the direction that your mind wants to go. These simple graphs reveal how the values are changing over time and thereby place…
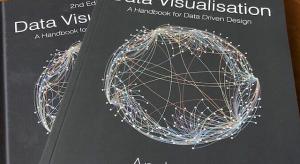
Paul Laughlin
This month I read Andy Kirk’s absorbing Data Visualisation 2, or to give it its proper title Data Visualisation 2nd Edition. The subtitle for this book is A Handbook for Data-Driven Design, which hints at how this is packed with advice.
Although the paperback version is a comfortable weight, it is…

Ryan Ayers
Data are valuable assets, so much so that they are the world’s most valuable resource. That makes understanding the different types of data—and the role of a data scientist—more important than ever. In the business world, more companies are trying to understand big numbers and what they can do with…

Davis Balestracci
“With data from an epidemic there is no question of whether a change has occurred. Change is everywhere. The question is whether we are getting better or worse. So while the process behavior chart may be the Swiss army knife of statistical techniques, there are times when we need to leave the knife…

Jeffrey Phillips
Throughout human history we’ve constantly sought out tools and capital to make us more productive. From the formation of basic tools to assist in farming to real cultivation and shaping of the land for greater yields, humankind learned to grow food. Further research into genetics, fertilizers, and…

Donald J. Wheeler
In May 2019, James Beagle and I published an article that contained tables for the analysis of mean moving ranges or ANOMmR (pronounced a-nom-m-r). By request of those using this technique, I have expanded these tables. This article contains these expanded tables and repeats the illustrative…

Donald J. Wheeler
The daily Covid-19 pandemic values tell us how things have changed from yesterday, and give us the current totals, but they are difficult to understand simply because they are only a small piece of the puzzle. This article will present a global perspective on the pandemic and show where the United…