| by Larry Bagan and Gary Phillips
MSA, the often-used abbreviation for measurement system analysis, refers to the use of analysis to predict the statistical properties of measurement systems. In the realm of calibration management, this analysis can apply to gauges and other measurement equipment, calibration procedures, or other means of collecting data.
The goal of MSA is to provide assurance and documentation that your organization’s calibration management is able to produce unbiased results as well as low gauge variability (i.e., minimum uncertainty) in comparison to process variation and tolerances.
Spreadsheets can handle most of the MSA techniques in popular use. They represent a low-cost solution for organizations, such as small shops, that rarely do an MSA study. Another user might be a problem-solving team that wants to do a gauge repeatability and reproducibility (GR&R) study before collecting data on a problem. The team might prefer the spreadsheet approach to taking the data to another department that has dedicated software for analysis. Templates for GR&R spreadsheets are available online at low cost or for free. For other types of MSA studies--such as bias, linearity, stability, and most attribute gauge studies--templates are hard to find and you’d probably need to create your own.
Companies that have their own calibration people and need to keep track of a large number of studies often will need to retrieve these studies at a moment’s notice for an auditor or customer. For this situation, spreadsheets can be an inefficient--and even risky--approach. Dedicated calibration software can provide better organization, security, and efficiency. All this can also come with a full set of MSA tools and a wide selection of high-quality graphics and charts to help interpret the information.
Accurate, basic calibration is necessary but insufficient for making sure that gauges are in good working order and that all measurements are trustworthy. Several common types of measurement errors aren’t likely to be detected except by using statistical tests. That group of tests is collectively known as MSA. The most common example is that a gauge might look good in calibration, but at the point of use, when measuring a particular characteristic on a particular part number, there’s a problem. GR&R tests are designed for variable gauges in this situation. There are also tests available for attribute gauges.
Problems can also occur in the calibration environment. Three tests--bias, linearity, and stability--focus on calibration issues. All three can calculate repeatability and bias. Reproducibility (variation caused by having multiple gauge users) generally isn’t an issue in calibration because all comparisons are made to reference values (e.g., gauge blocks). Therefore, the GR&R test should rarely be recommended for calibration systems.
In summary, MSA can be defined as a group of statistical tests that, with occasional use, can verify that there is or isn’t a problem with the use (GR&R) or calibration (bias, linearity, or stability) of gauges. If these tests aren’t used, measurement systems will be less trustworthy.
The easiest way to clarify MSA terminology is with illustrated examples, which can be seen in figures 1-5. These statistical test procedures make up the family of MSA studies.
• Repeatability (equipment variation). Gauge repeatability is the measurement variation that occurs when one appraiser uses the same gauge to measure identical characteristics of the same parts, as seen in figure 1, right.
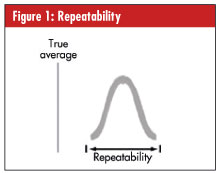
• Reproducibility (appraiser variation). When more than one appraiser uses the same gauge to measure identical characteristics on the same parts, an unexpected variation in the average of these measurements is known as gauge reproducibility, as seen in figure 2, right.
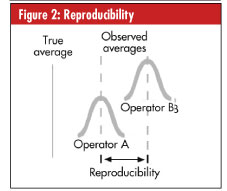
• Bias. The difference between the observed average of measurements and the reference value is known as bias, sometimes called “accuracy,” although this is a qualitative term that should be avoided when referring to bias. See figure 3, right.
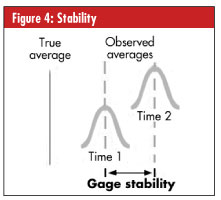
• Stability. When using a measurement system to evaluate the same characteristic on a master or a part over an extended period of time, the maximum change in bias is known as stability uncertainty (or drift), as seen in figure 4, right
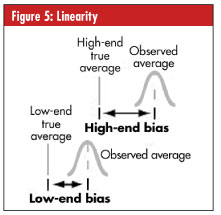
• Linearity. Linearity is the difference in the bias (i.e., accuracy) values through the gauge’s estimated operating range, as seen in figure 5, right.
Let’s look at some specific applications for MSA. For the purpose of illustration, we’ll focus on testing for failure modes that occur after calibration. With any type of product or process failure, measuring system failure is always a possible cause. MSA can be described as a series of tests designed to detect common failure modes in measurement processes.
GR&R was used to verify a production-measuring system by analyzing 10 randomly selected production parts. Three employees repeated these measurements three times each for a total of 90 measurements. The same characteristic (e.g., diameter) was measured on each of the 10 parts.
The run chart in figure 6, below, illustrates the part variation as a zig-zag pattern for each of the three operators. The line patterns should be closely grouped, and corresponding line segments should be approximately parallel to each other.
In this case the pattern for operator B is lower than the others, a problem called “reproducibility” or “AV” for appraiser variation. Also, a few line segments aren’t parallel, a problem called “interaction” or “INT.” Interaction is a type of error caused by inconsistent differences of bias with one operator over different parts. Note that operator B fairly consistently measures parts as being a little smaller than operator C’s measurements; this bias is consistent across all parts, so there’s little interaction error. Operator A, on the other hand, is sometimes much higher and sometimes much lower than operator C; thus, there’s interaction error.
The range control chart seen in figure 7 below shows the variation experienced by each of the three operators during the three times that they measured the same part. The first 10 points are operator A, and the last 10 points are operator C. Key things to look for here are that detectible variation is present, and there are no out-of-control signals such as a point outside of the control limits. Points outside of the control limits would suggest that typos or measurement glitches had occurred. This chart meets the basic requirements.
The calculations at the bottom of the software screen seen in figure 8 below are used to determine whether any of the problems found are big enough to worry about.
Customers usually express their requirement as a maximum limit for the combined variability of repeatability, reproducibility, and interaction, or GR&R. Usually, the limit is expressed as a percentage of total variation, or a percentage of tolerance, or both. Sometimes customers specify instead a suitable limit for one of the other statistics, as seen in figure 8.
Note that the software can only calculate interaction when the analysis of variance (ANOVA) calculating method is specified; otherwise, interaction will be ignored. Also, failure modes that aren’t statistically significant will display as zero.
In this example, a gauge was selected as representative of its type. Following calibration, a single reference value (e.g., gauge block) would have been measured 15 times instead of once. The histogram in figure 9, below, shows that the average difference between the gauge and the reference value, or bias, is slightly larger than zero.
The linearity test is, in a sense, a more elaborate bias test. Multiple reference values (e.g., gauge blocks) are used to see whether bias might vary according to the size of the reference value. In the example in figure 10, below, the device was first calibrated at 6 inches, and then five different reference values of 2, 4, 6, 8, and 10 inches were measured 12 times each. In the linearity chart, we’re looking for four things:
1. Do the various groups of points have a good fit to an imaginary straight line? (Mediocre in this case.)
2. Is the imaginary straight line nearly horizontal with zero slope? (No.)
3. Does the lower curved limit stay below zero bias and the upper curved limit stay above zero bias? (No.)
4. Does the imaginary straight line intercept the vertical axis of the chart (the axis is shown here at the left side of the chart) near zero bias? (No.)
The screen shot in figure 12, below, uses standard statistical limits to confirm that the intercept and slope are too far from zero.
The stability test measures a reference value periodically to determine whether the gauge calibration has remained stable over the length of the calibration interval. Data are collected in about 25 subgroups of one or more; subgroup size is often either three or five. If the calibration interval were six months, you would then collect a subgroup each week. Companies that work with measurements which can’t be repeated should make sure that their software or spreadsheets can accept a subgroup size of one.
In this example, the subgroup size was five, and a subgroup was collected daily. The control charts seen in figure 11 below use limits based on repeatability.
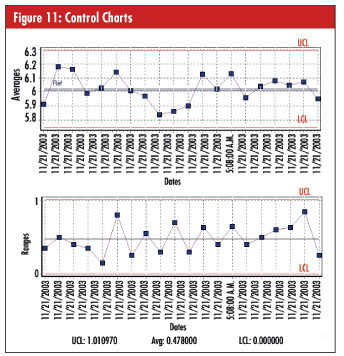
In this case, the averages chart, which tracks bias, is in control, so there’s no stability problem. The ranges chart, which tracks repeatability, is in control, so there’s no consistency problem.
To determine if you might be ready to upgrade to a formal calibration management software solution for GR&R or MSA, ask yourself these questions:
1. How would this type of solution make my company more efficient and productive?
2. What level of improvement and efficiency gains does my company strive for, and at what level is my company’s current calibration management program?
3. How could my company benefit from marketing the use of a formal calibration software solution to customers?
4. How much easier and less stressful would a formal calibration software solution make documentation and audits for me and my company?
5. How much time and effort would the built-in automation of a formal solution save me and my company?
6. Would my company be willing to make the investment to increase my productivity by 20 percent or more?
Formal calibration software programs have provided viable calibration management solutions, including GR&R and MSA, for two decades because they can be less cumbersome than spreadsheets, make easy work of entering and retrieving calibration records, automate events such as flagging out-of-tolerance gauges and e-mail notifications, and provide a new level of security.
Many calibration software solutions provide easy-to-use data-transfer utilities that safely and quickly move your data from a spreadsheet into the calibration software solution’s database. Calibration software solutions have become perfectly easy to use during the past 20 years, and, given the wide range of calibration management solutions available, there’s one to meet almost every budget. The automatic calculations and graphing provided by good calibration management software save time and energy, and subsequently, money.
Larry Bagan is the president of CyberMetrics’ Quality and Calibration Products Division. Over the past two years, Bagan has helped to drive the growth of CyberMetrics and its GAGEtrak calibration management software solution to all-time record highs in sales and service.
Gary Phillips has consulted for several years on measurement systems analysis, quality methods, and quality standards. Previously, he was a manager at General Motors in areas such as supplier quality, metrology, supplier auditing, quality engineering, internal auditing, process documentation, APQP, and project management.
|